
Fichier:Bmi30chart.png
Taille de cet aperçu : 800 × 455 pixels. Autres résolutions : 320 × 182 pixels | 640 × 364 pixels | 1 024 × 582 pixels | 1 600 × 910 pixels.
Fichier d’origine (1 600 × 910 pixels, taille du fichier : 55 kio, type MIME : image/png)
Ce fichier et sa description proviennent de Wikimedia Commons.
Description
| Description |
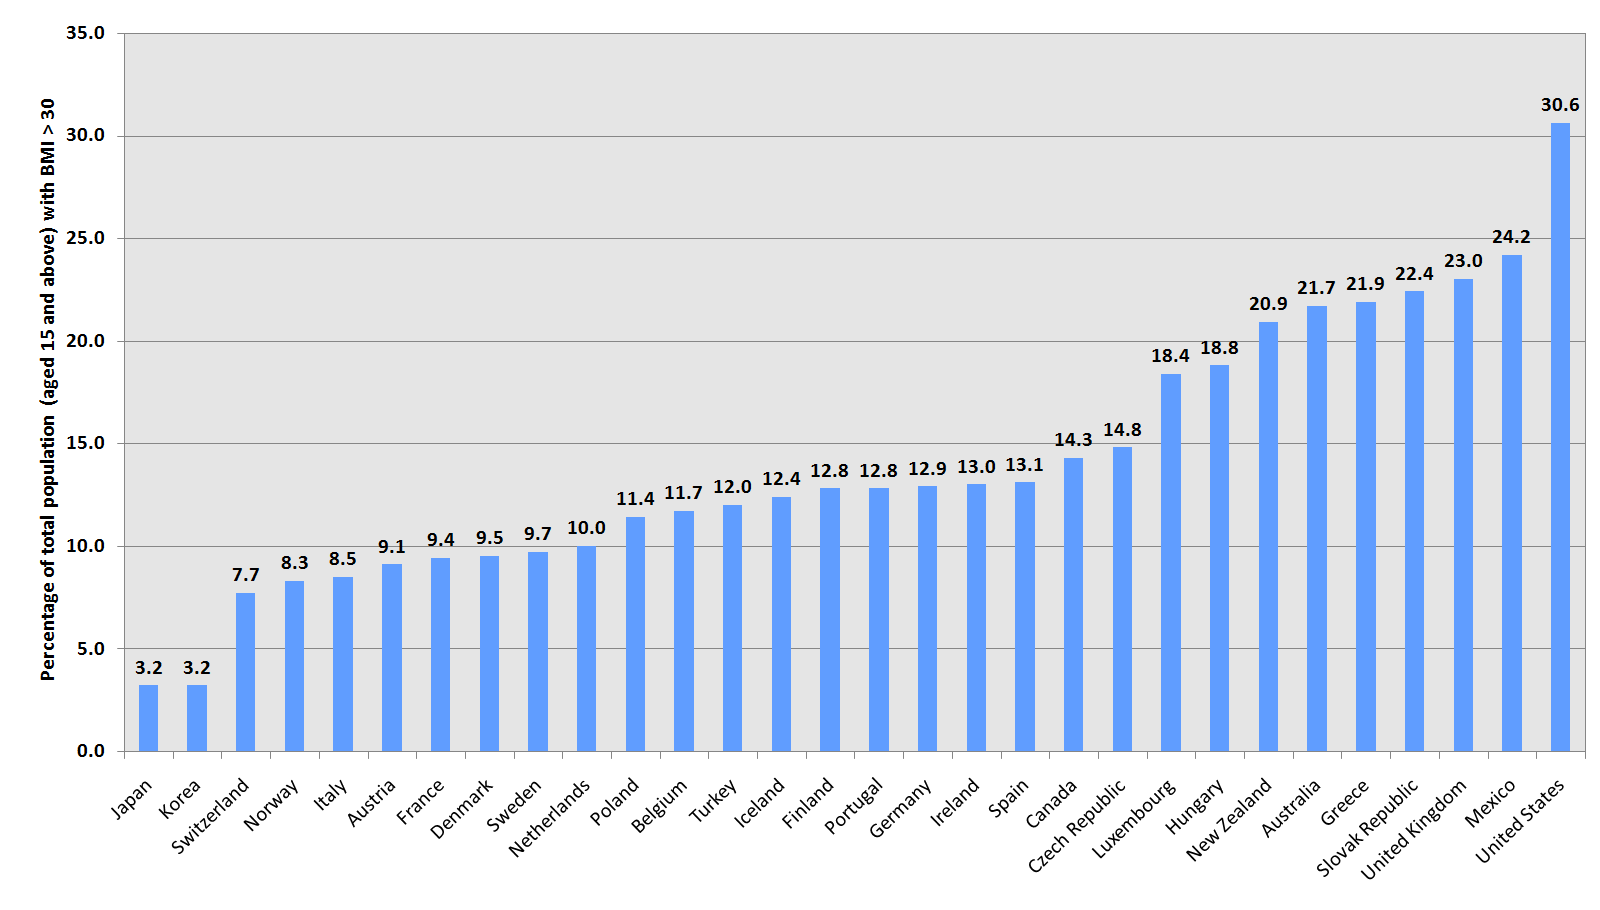
English: This chart compares figures in the population of OECD countries (plus the Czech Republic, Hungary, Poland, Slovakia and Mexico); it shows the percentage of total population (aged 15 and above) with a body mass index greater than 30. The year the figures used for this chart were published, collected or compiled range from 1996 to 2003. Exact years for each country can be found in the documents linked below. |
| Date | 25 mai 2005 (date de téléversement originale) |
| Source |
Graphic chart created by User:Phils using Microsoft Excel 2004 (Mac) and OECD data available for download and discussed here. The actual data was extracted from an Excel data sheet downloadable here, which contains the following source information:
|
| Auteur | Phils sur Wikipédia anglais |
| Autres versions | An alternate copyrighted graph of the same data, published by OECD can be viewed here. |
Conditions d’utilisation
| Ce fichier est disponible selon les termes de la licence Creative Commons Attribution – Partage dans les Mêmes Conditions 3.0 (non transposée). Sujet aux avertissements. | ||
| ||
| Ce bandeau de licence a été ajouté à ce fichier dans le cadre de la procédure de mise à jour des licences des images sous GFDL. |

|
Vous avez la permission de copier, distribuer et modifier ce document selon les termes de la GNU Free Documentation License version 1.2 ou toute version ultérieure publiée par la Free Software Foundation, sans sections inaltérables, sans texte de première page de couverture et sans texte de dernière page de couverture. Un exemplaire de la licence est inclus dans la section intitulée GNU Free Documentation License. Sujet aux avertissements. |
Journal des téléversements d’origine
La page de description originale était ici. Tous les noms d'utilisateur qui suivent se rapportent à en.wikipedia.
- 2007-03-24 22:42 AtilimGunesBaydin 1600×910× (56622 bytes) Updated with current data from OECD. Added Greece and Turkey existing in the OECD publication and original graph, but missing in the user-created version. Also minor changes in the order of countries.
- 2005-05-25 14:10 Phils 1467×901× (122414 bytes) {{GFDL}} This chart compares obesity figures in the population of OECD countries; it shows the percentage of total population (aged 15 and above) with a body-mass index greater than 30. The year the figures used for this chart were published, collected or
- 2005-05-25 10:46 Phils 0×0× (7028 bytes) {{GFDL}} This chart compares obesity figures in the population of OECD countries; it shows the percentage of total population (aged 15 and above) with a body-mass index greater than 30. The year the figures used for this chart were published, collected or (version lost by MediaWiki)
Historique du fichier
Cliquer sur une date et heure pour voir le fichier tel qu'il était à ce moment-là.
| Date et heure | Vignette | Dimensions | Utilisateur | Commentaire | |
|---|---|---|---|---|---|
| actuel | 10 septembre 2012 à 18:34 | | 1 600 × 910 (55 kio) | OgreBot | (BOT): Uploading old version of file from en.wikipedia; originally uploaded on 2007-03-24 22:42:19 by AtilimGunesBaydin |
| 4 mai 2006 à 19:11 |  | 1 467 × 901 (120 kio) | Deprifry | This chart compares obesity figures in the population of OECD countries; it shows the percentage of total population (aged 15 and above) with a body-mass index greater than 30. The year the figures used for this chart were published, collected or compiled |
Utilisation du fichier
La page suivante utilise ce fichier :
Usage global du fichier
Les autres wikis suivants utilisent ce fichier :
- Utilisation sur ast.wikipedia.org
- Utilisation sur de.wikipedia.org
- Utilisation sur en.wikipedia.org
- Utilisation sur en.wikinews.org
- Utilisation sur fi.wikipedia.org
- Utilisation sur it.wikipedia.org
- Utilisation sur ja.wikipedia.org
- Utilisation sur simple.wikipedia.org
- Utilisation sur sr.wikipedia.org