
Fichier:Milankovitch Variations.png
Milankovitch_Variations.png (479 × 363 pixels, taille du fichier : 32 kio, type MIME : image/png)
Ce fichier et sa description proviennent de Wikimedia Commons.
Description
| Description |
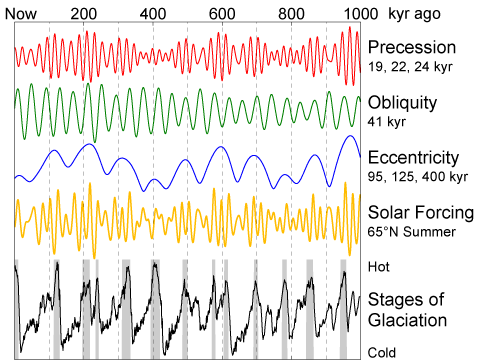
English: This figure shows the variations in Earth's orbit, the resulting changes in solar energy flux at high latitude, and the observed glacial cycles.
According to Milankovitch Theory, the precession of the equinoxes and the apsides, variations in the tilt of the Earth's axis (obliquity) and changes in the eccentricity of the Earth's orbit are responsible for causing the observed 100 kyr cycle in ice ages by varying the amount of sunlight received by the Earth at different times and locations, particularly high northern latitude summer. These changes in the Earth's orbit are the predictable consequence of interactions between the Earth, its moon, and the other planets. The orbital data shown are from Quinn et al. (1991). Principal frequencies for each of the three kinds of variations are labeled. The solar forcing curve (aka "insolation") is derived from July 1st sunlight at 65 °N latitude according to Jonathan Levine's insolation calculator [1]. The glacial data are from Lisiecki and Raymo (2005) and gray bars indicate interglacial periods, defined here as deviations in the 5 kyr average of at least 0.8 standard deviations above the mean. |
| Date | 11 février 2006 (date de téléversement) |
| Source | Travail personnel |
| Auteur | This image was produced by Robert A. Rohde from publicly available data, and is incorporated into the Global Warming Art project. |
| Autres versions | Œuvres dérivées de ce fichier : Variacions de Milankovitch.png |
References
- Lisiecki, L. E., and M. E. Raymo (2005), "A Pliocene-Pleistocene stack of 57 globally distributed benthic δ18O records." Paleoceanography 20, PA1003, doi:10.1029/2004PA001071 (alternative full text link: [2]).
- Quinn, T. R., S. Tremaine, and M. Duncan (1991), "A Three Million Year Integration of the Earth's Orbit." The Astronomical Journal 101, pp. 2287-2305, doi:10.1086/115850.

|
Cette image (de type graphique) devrait être recréée dans un format vectoriel, en tant que fichier SVG. Cela offrirait plusieurs avantages : voir Commons:Media for cleanup pour plus d'informations. Si une version SVG de cette image est déjà disponible, merci de bien vouloir l'envoyer. Après cela, remplacez ce modèle par {{vector version available|nouveau nom d'image.svg}}.
|
Conditions d’utilisation

|
Vous avez la permission de copier, distribuer et modifier ce document selon les termes de la GNU Free Documentation License version 1.2 ou toute version ultérieure publiée par la Free Software Foundation, sans sections inaltérables, sans texte de première page de couverture et sans texte de dernière page de couverture. Un exemplaire de la licence est inclus dans la section intitulée GNU Free Documentation License. |
| Ce fichier est disponible selon les termes de la licence Creative Commons Attribution – Partage dans les Mêmes Conditions 3.0 (non transposée). | ||
| ||
| Ce bandeau de licence a été ajouté à ce fichier dans le cadre de la procédure de mise à jour des licences des images sous GFDL. |
Historique du fichier
Cliquer sur une date et heure pour voir le fichier tel qu'il était à ce moment-là.
| Date et heure | Vignette | Dimensions | Utilisateur | Commentaire | |
|---|---|---|---|---|---|
| actuel | 11 février 2006 à 13:35 | | 479 × 363 (32 kio) | David Legrand | == Description == This figure shows the variations in Earth's orbit, the resulting changes in solar energy flux at high latitude, and the observed glacial cycles. According to Milankovitch Theory, the precession of the [[ |
Utilisation du fichier
Les 9 pages suivantes utilisent ce fichier :
Usage global du fichier
Les autres wikis suivants utilisent ce fichier :
- Utilisation sur af.wikipedia.org
- Utilisation sur ar.wikipedia.org
- Utilisation sur be.wikipedia.org
- Utilisation sur bg.wikipedia.org
- Utilisation sur ca.wikipedia.org
- Utilisation sur da.wikipedia.org
- Utilisation sur de.wikipedia.org
- Utilisation sur de.wikiversity.org
- Utilisation sur el.wikipedia.org
- Utilisation sur en.wikipedia.org
- Utilisation sur es.wikipedia.org
- Utilisation sur fa.wikipedia.org
- Utilisation sur fi.wikipedia.org
- Utilisation sur fy.wikipedia.org
- Utilisation sur gl.wikipedia.org
- Utilisation sur hu.wikipedia.org
- Utilisation sur hy.wikipedia.org
- Utilisation sur id.wikipedia.org
- Utilisation sur ja.wikipedia.org
- Utilisation sur ko.wikipedia.org
- Utilisation sur nl.wikipedia.org
- Utilisation sur no.wikipedia.org
- Utilisation sur pl.wikipedia.org
- Utilisation sur pt.wikipedia.org
- Utilisation sur uk.wikipedia.org
- Utilisation sur vi.wikipedia.org
Voir davantage sur l’utilisation globale de ce fichier.