
Fichier:Hayward fault california.tif

Taille de cet aperçu JPG pour ce fichier TIF : 536 × 599 pixels. Autres résolutions : 215 × 240 pixels | 429 × 480 pixels | 687 × 768 pixels | 916 × 1 024 pixels | 2 135 × 2 386 pixels.
Fichier d’origine (2 135 × 2 386 pixels, taille du fichier : 10,56 Mio, type MIME : image/tiff)
Ce fichier et sa description proviennent de Wikimedia Commons.
Description
| Description |
English: This image of California's Hayward fault is an interferogram created using a pair of images taken by Synthetic Aperture Radar (SAR) combined to measure changes in the surface that may have occurred between the time the two images were taken.
The images were collected by the European Space Agency's Remote Sensing satellites ERS-1 and ERS-2 in June 1992 and September 1997 over the central San Francisco Bay in California. The radar image data are shown as a gray-scale image, with the interferometric measurements that show the changes rendered in color. Only the urbanized area could be mapped with these data. The color changes from orange tones to blue tones across the Hayward fault (marked by a thin red line) show about 2-3 centimeters (0.8-1.1 inches) of gradual displacement or movement of the southwest side of the fault. The block west of the fault moved horizontally toward the northwest during the 63 months between the acquisition of the two SAR images. This fault movement is called aseismic creep because the fault moved slowly without generating an earthquake. |
| Date | |
| Source | http://visibleearth.nasa.gov/view_rec.php?id=730 |
| Auteur | NASA JPL, University of California at Berkeley, Lawrence Berkeley National Laboratory |
Conditions d’utilisation
| Ce fichier provient de la NASA. Sauf exception, les documents créés par la NASA ne sont pas soumis à copyright. Pour plus d'informations, voir la politique de copyright de la NASA. | ||
 |
Attention :
|
Historique du fichier
Cliquer sur une date et heure pour voir le fichier tel qu'il était à ce moment-là.
| Date et heure | Vignette | Dimensions | Utilisateur | Commentaire | |
|---|---|---|---|---|---|
| actuel | 4 mars 2011 à 11:26 | 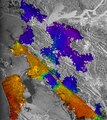 | 2 135 × 2 386 (10,56 Mio) | Kkaattaa8 | {{Information |Description ={{en|1=This image of California's Hayward fault is an interferogram created using a pair of images taken by Synthetic Aperture Radar (SAR) combined to measure changes in the surface that may have occurred between the time th |
Utilisation du fichier
La page suivante utilise ce fichier :
Usage global du fichier
Les autres wikis suivants utilisent ce fichier :
- Utilisation sur hu.wikipedia.org