
Fichier:Energy density.svg

Taille de cet aperçu PNG pour ce fichier SVG : 800 × 500 pixels. Autres résolutions : 320 × 200 pixels | 640 × 400 pixels | 1 024 × 640 pixels | 1 280 × 800 pixels | 2 560 × 1 600 pixels | 1 080 × 675 pixels.
Fichier d’origine (Fichier SVG, nominalement de 1 080 × 675 pixels, taille : 64 kio)
Ce fichier et sa description proviennent de Wikimedia Commons.
Description
| Description |
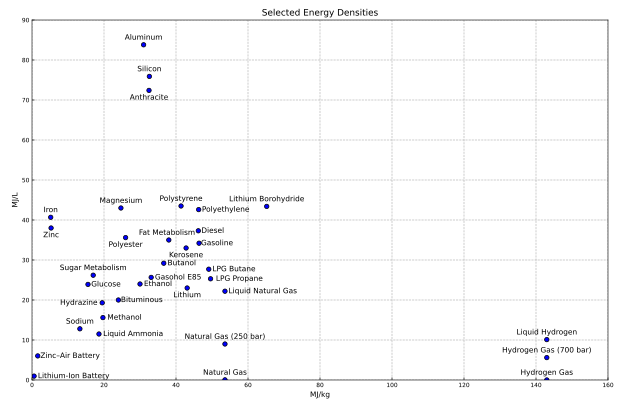
English: A plot of selected energy densities (excluding oxidizers). |
| Date | |
| Source |
Travail personnel |
| Auteur | Scott Dial |
| Autres versions |
Œuvres dérivées de ce fichier : Energy density-fr.svg Image:Energy_Density.PNG |
| SVG information | Cette représentation graphique a été créée avec Matplotlib |
| Code source | Python code#!/usr/bin/env python3
# -*- encoding: utf-8 -*-
import matplotlib
matplotlib.use('agg')
from matplotlib.font_manager import FontProperties
import pylab
import sys
# (name, MJ/kg, MJ/L, [label-adjustments])
data = (
('Aluminum', 31.0, 83.8),
('Anthracite', 32.5, 72.4, {'valign': 'top'}),
('Bituminous', 24, 20, {'valign': 'center', 'x': 6.5}),
('Butanol', 36.6, 29.2, {'valign': 'center', 'x': 5}),
('Diesel', 46.2, 37.3, {'valign': 'center', 'x': 4}),
('Ethanol', 30, 24, {'valign': 'center', 'x': 5}),
('Fat Metabolism', 38, 35, {'x': -0.5}),
('Gasoline', 46.4, 34.2, {'valign': 'center', 'x': 5}),
('Gasohol E85', 33.1, 25.65, {'valign': 'center', 'x': 7.5}),
('Glucose', 15.55, 23.9, {'valign': 'center', 'x': 5}),
('Hydrazine', 19.5, 19.3, {'valign': 'center', 'x': -6.5}),
('Hydrogen Gas', 143, 0.01079),
('Hydrogen Gas (700 bar)', 143, 5.6),
('Iron', 5.2, 40.68), # (burned to Fe2O3)
('Kerosene', 42.8, 33, {'valign': 'top'}),
('Liquid Ammonia', 18.6, 11.5, {'valign': 'center', 'x': 9.5}),
('Liquid Hydrogen', 143, 10.1),
('Liquid Natural Gas', 53.6, 22.2, {'valign': 'center', 'x': 10.5}),
('Lithium', 43.1, 23.0, {'valign': 'top'}),
('Lithium Borohydride', 65.2, 43.4),
('LPG Propane', 49.6, 25.3, {'valign': 'center', 'x': 8}),
('LPG Butane', 49.1, 27.7, {'valign': 'center', 'x': 7}),
('Magnesium', 24.7, 43.0),
('Methanol', 19.7, 15.6, {'valign': 'center', 'x': 6}),
('Natural Gas', 53.6, 0.0364),
('Natural Gas (250 bar)', 53.6, 9),
('Polyester', 26.0, 35.6, {'valign': 'top'}),
('Polyethylene', 46.3, 42.6, {'valign': 'center', 'x': 7.5}),
('Polystyrene', 41.4, 43.5),
('Silicon', 32.6, 75.9),
('Sodium', 13.3, 12.8), # (burned to wet NaOH)
('Sugar Metabolism', 17, 26.2),
('Zinc', 5.3, 38.0, {'valign': 'top'}),
('Zinc–Air Battery', 1.59, 6.02, {'valign': 'center', 'x': 9}),
# 0.54-0.72, 0.9-1.9 (values used are from the Li-Ion battery article)
('Lithium-Ion Battery', 0.576, 0.972, {'valign': 'center', 'x': 11}),
)
font12 = FontProperties(family=['sans-serif'], size=12)
font10 = FontProperties(family=['sans-serif'], size=10)
font8 = FontProperties(family=['sans-serif'], size=8)
pylab.rcParams.update({'figure.figsize': [12, 7.5]})
fig=pylab.figure(1)
ax=pylab.axes([0.05, 0.05, 0.95 - 0.05, 0.95 - 0.05])
ax.set_axisbelow(True)
for v in data:
# (name, MJ/kg, MJ/L, label-adjustments)
label = v[0]
x = v[1]
y = v[2]
if len(v) < 4:
halign = 'center'
valign = 'bottom'
x_text = x
y_text = y + 0.9
else:
halign = v[3].get('halign', 'center')
valign = v[3].get('valign', 'bottom')
x_text = x + v[3].get('x', 0)
y_text = y + v[3].get('y', 0)
if valign == 'bottom':
y_text += 0.9
elif valign == 'top':
y_text -= 0.9
pylab.scatter(x=[x], y=[y], c='b', edgecolors='black')
pylab.text(x=x_text, y=y_text, s=label,
horizontalalignment=halign,
verticalalignment=valign,
fontproperties=font10)
pylab.title('Selected Energy Densities',
fontproperties=font12)
pylab.ylabel('MJ/L', fontproperties=font10)
pylab.xlabel('MJ/kg', fontproperties=font10)
pylab.xticks(fontproperties=font8)
pylab.yticks(fontproperties=font8)
ax.grid(linestyle='dashed')
ax.tick_params(axis="y", direction="in")
ax.tick_params(axis="x", direction="in")
ax.xaxis.grid(True)
ax.yaxis.grid(True)
pylab.xlim(0, 160)
pylab.ylim(0, 90)
pylab.savefig('energy_density.svg', transparent=True)
|
Conditions d’utilisation
| Moi, propriétaire des droits d’auteur sur cette œuvre, la place dans le domaine public. Ceci s'applique dans le monde entier. Dans certains pays, ceci peut ne pas être possible ; dans ce cas : J’accorde à toute personne le droit d’utiliser cette œuvre dans n’importe quel but, sans aucune condition, sauf celles requises par la loi. |
Historique du fichier
Cliquer sur une date et heure pour voir le fichier tel qu'il était à ce moment-là.
| Date et heure | Vignette | Dimensions | Utilisateur | Commentaire | |
|---|---|---|---|---|---|
| actuel | 23 janvier 2023 à 14:58 | | 1 080 × 675 (64 kio) | Scott Dial | Restore background transparency |
| 23 janvier 2023 à 14:53 |  | 1 080 × 675 (63 kio) | Scott Dial | Restored title capitalization | |
| 23 janvier 2023 à 14:41 |  | 1 080 × 675 (63 kio) | Scott Dial | Fix ticks to be inside of the plot area | |
| 23 janvier 2023 à 14:33 |  | 1 080 × 675 (63 kio) | Scott Dial | Restored original chart style | |
| 2 novembre 2021 à 21:31 |  | 1 080 × 675 (75 kio) | Mikhail Ryazanov | rm. capitalitis, upd. for modern Python | |
| 9 février 2011 à 07:51 |  | 1 080 × 675 (114 kio) | Scott Dial | Added and updated points in the graph. | |
| 10 février 2009 à 01:46 |  | 1 080 × 675 (102 kio) | Scott Dial | Added Li-Ion Battery and removed Teflon | |
| 22 décembre 2008 à 21:30 |  | 1 080 × 675 (104 kio) | Scott Dial | {{Information |Description={{en|1=A plot of selected energy densities (excluding oxidizers).}} |Source=Own work by uploader |Author=Scott Dial |Date=December 22, 2008 |Permission= |other_versions=Image:Energy_Density.PNG }} Data S |
Utilisation du fichier
Les 2 pages suivantes utilisent ce fichier :
Usage global du fichier
Les autres wikis suivants utilisent ce fichier :
- Utilisation sur da.wikipedia.org
- Utilisation sur en.wikipedia.org
- Utilisation sur fi.wikipedia.org
- Utilisation sur fr.wikiversity.org
- Utilisation sur sl.wikipedia.org
- Utilisation sur tr.wikipedia.org
- Utilisation sur zh.wikipedia.org