
Fichier:Sonnenstand.png

Taille de cet aperçu : 800 × 304 pixels. Autres résolutions : 320 × 121 pixels | 640 × 243 pixels | 1 805 × 685 pixels.
Fichier d’origine (1 805 × 685 pixels, taille du fichier : 333 kio, type MIME : image/png)
Ce fichier et sa description proviennent de Wikimedia Commons.
Infobox
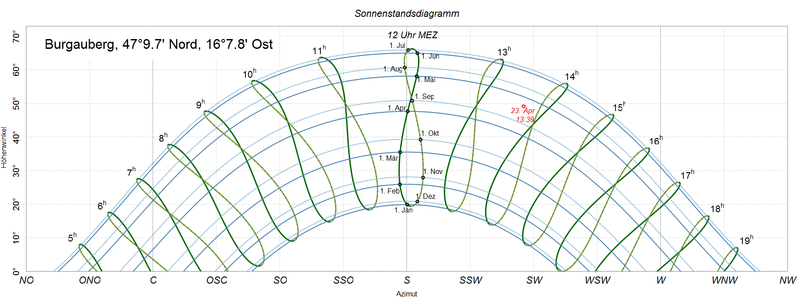
| Description | ein Sonnenstandsdiagramm für Burgauberg, es zeigt für alle vollen Stunden den Sonnenstand an sowie für jeden Monatsersten den Tagesbogen. Außerdem wird der Sonnenstand an einem bestimmten Tag zu einem bestimmten Zeitpunkt braun eingezeichnet |
| Date | |
| Source | made with en:R_Project, see source code below. values of the constants from http://aom.giss.nasa.gov/srorbpar.html formulas from Blatter's paper: http://dz-srv1.sub.uni-goettingen.de/sub/digbib/loader?did=D241775 or http://www.math.ethz.ch/~blatter/Sonnenuhr.pdf |
| Auteur | Thomas Steiner |
| Autorisation (Réutilisation de ce fichier) |
Thomas Steiner put it under the CC-by-SA 2.5. |
| Autres versions | eg de:Bild:Sonnenstandsdiagramm Wien 300dpi.png |
Ce fichier est disponible selon les termes de la licence Creative Commons Attribution – Partage dans les Mêmes Conditions 2.5 Générique
- Vous êtes libre :
- de partager – de copier, distribuer et transmettre cette œuvre
- d’adapter – de modifier cette œuvre
- Sous les conditions suivantes :
- paternité – Vous devez donner les informations appropriées concernant l'auteur, fournir un lien vers la licence et indiquer si des modifications ont été faites. Vous pouvez faire cela par tout moyen raisonnable, mais en aucune façon suggérant que l’auteur vous soutient ou approuve l’utilisation que vous en faites.
- partage à l’identique – Si vous modifiez, transformez, ou vous basez sur cette œuvre, vous devez distribuer votre contribution sous la même licence ou une licence compatible avec celle de l’original.
| Lieu de la prise de vue | | Voir cet endroit et d’autres images sur : OpenStreetMap |
|---|
R-Code
TODO-list: improve
- real default arguments
- svg file for wikimedia
- global variable for eot=0. different formula?
- automatic xlim (length of longest day)
- check different locations: sun in north at 12?
- find a solution for summertime for the points: is there summertime for a give date at a given location?
- different pagesize for polar and cartesian types. and better pdf size
PNG information
Code source
R code
#to adapt change these eight first lines only
locationname="Burgauberg"
phi=47.162
lambda=16.130
out=""        #""/png/jpg/svg/pdf
type="cart"   #cart/polar
lang="de"     #de/en/it/nl
locale="German_Austria" #month names German_Austria/English/Italian/Dutch
ieqot=F       #F/T (do not take equation of time into account)
summert=0     #1/0 (summertime normal time)

if (lang=="de") {
  ltext=c("N","O","S","W","Nord","Ost","Süd","West","Azimuth","Höhenwinkel","MEZ","MESZ","Uhr","Sonnenstandsdiagramm","Zenit","Horizont")
} else if (lang=="en") {
  ltext=c("N","E","S","W","north","east","south","west","azimuth","elevation angle","CET","CEST","","sun chart","Zenith","Horizon")
} else if (lang=="it") {
  ltext=c("N","E","S","O","Nord","Est","Sud","Ovest","azimut","altezza","CET","CEST","","Diagramma solare","Zenit","Orizzonte")
} else if (lang=="nl") {
  ltext=c("N","O","Z","W","NB","OL","ZB","WL","Azimut","Hoogte","CET","CEST","","Zonnestanddiagram","Zenit","Horizon")
}


phi=phi*pi/180
lambda=lambda*pi/180
KAPPA=0.016700
EPSILON=23.4385*pi/180
ALPHA=(360-283.067)*pi/180  #77.6°
Sys.setlocale("LC_TIME", locale)
library("Cairo")    #for nice plot into files
require("plotrix")  #for polar plots (and other stuff?)
require("geonames") #to find the perfect timezone
TZ=as.numeric(GNtimezone(phi*180/pi,lambda*180/pi)[3])  #manual: round((lambda*180/pi)/15)
if (!exists(x="TZ",mode="numeric")) {
  TZ=round((lambda*180/pi)/15)
}
h=function(t,KAPPA=KAPPA,EPSILON=EPSILON,ALPHA=ALPHA) {
  return( sin(t+delta(t,KAPPA)-ALPHA)*sin(EPSILON) )
}

r=function(t,KAPPA=KAPPA,EPSILON=EPSILON,ALPHA=ALPHA) {
  return( sqrt(1-h(t,KAPPA,EPSILON,ALPHA)^2) )
}

mu=function(t,ignore=F,KAPPA=KAPPA,EPSILON=EPSILON,ALPHA=ALPHA) {
  zaehl=-sin(delta(t,KAPPA))+tan(EPSILON/2)^2*sin(2*(t-ALPHA)+delta(t,KAPPA))
  nenn = cos(delta(t,KAPPA))+tan(EPSILON/2)^2*cos(2*(t-ALPHA)+delta(t,KAPPA))
  if (ignore) { res=0 } else { res=atan(zaehl/nenn) }  #ignore the eq of time
  return( res )
}

delta=function(t,KAPPA=KAPPA) {
  return( 2*KAPPA*sin(t)+5/4*KAPPA^2*sin(2*t) )
}

coords=function(t,S,phi,lambda,ignore=ieqot,KAPPA=KAPPA,EPSILON=EPSILON,ALPHA=ALPHA,tz=TZ) {
  s=pi/180*15*(S+lambda*180/pi/15-tz)
  x1= r(t,KAPPA,EPSILON,ALPHA)*sin(s+mu(t,ignore,KAPPA,EPSILON,ALPHA))
  x2= r(t,KAPPA,EPSILON,ALPHA)*cos(s+mu(t,ignore,KAPPA,EPSILON,ALPHA))*sin(phi)+h(t,KAPPA,EPSILON,ALPHA)*cos(phi)
  x3=-r(t,KAPPA,EPSILON,ALPHA)*cos(s+mu(t,ignore,KAPPA,EPSILON,ALPHA))*cos(phi)+h(t,KAPPA,EPSILON,ALPHA)*sin(phi)
  return(cbind(x1,x2,x3))
}

#returns the angle for sperical coordinates
coord2angle=function(coord,filterout=TRUE) {
  diag=sqrt(coord[,1]^2+coord[,2]^2)
  psi=atan2(coord[,2],coord[,1])
  phi=pi/2-atan(coord[,3]/diag)
  azi=pi/2-psi
  hoeh=pi/2-phi
  azi[azi<0]=azi[azi<0]+2*pi
  if (filterout) {
    hoeh[hoeh<0]=NA
    azi[hoeh<0]=NA
  }
  return( 180/pi*cbind(azi, hoeh) )
  ##hoeh=wasserglas(alpha=hoeh,D=wgD,d=wgd,n1=wgn1,n2=wgn2,n3=wgn3)
  ##return( cbind(azi*180/pi, hoeh) )
}

#transforms an angle to a formated date
angle2date=function(w){
  day=(w/(2*pi))*365
  dates=as.Date("2009-01-01")+day
  if (lang=="de"){
  fdate=format(dates, format="%d. %b")
  } else {
  fdate=format(dates, format="%d %b")
  }
return( fdate )
}

#gets the coordinates and returns a nice desciptive string
location=function(long,lat,name) {
  long=long*180/pi
  if (long<0) { longStr=ltext[8] } else { longStr=ltext[6] }
  lon1=trunc(long+0.00001) #to avoid output 14°60' for 15°0'
  lon2=60*(long-lon1)
  lat=lat*180/pi
  if (lat <0) { latStr =ltext[7] } else { latStr=ltext[5] }
  lat1=trunc(lat+0.00001) #to avoid output 14°60' for 15°0'
  lat2=60*(lat-lat1)
  latlon=paste(abs(lat1),"°",abs(round(lat2,digits=1)),as.character("' "),latStr,", ",abs(lon1),"°",abs(round(lon2,1)),as.character("' "),longStr,sep="")
  string=paste(name,latlon,sep=", ")
  return(string)
}

#Analemma for all hours
analemmabogen=function(suntype="cart",phi=phi,lambda=lambda,KAPPA=KAPPA,EPSILON=EPSILON,ALPHA=ALPHA) {
  jz=seq(0,2*pi,length=365*2)-9/365*2*pi
  sz=seq(0,23,by=1)
  for (si in 1:length(sz)) {
    ko=coords(t=jz,S=sz[si],phi=phi,lambda=lambda,ignore=ieqot,KAPPA=KAPPA,EPSILON=EPSILON,ALPHA=ALPHA,tz=TZ)
    ang=coord2angle(ko,filterout=TRUE)

    mitte=ceiling(length(jz)/2)
    sunlines(suntype=type,x=ang[1:mitte,1],y=ang[1:mitte,2],type="l",lwd=3,col="darkgreen")
    if (!ieqot) { sunlines(suntype=type,x=ang[mitte:length(jz),1],y=ang[mitte:length(jz),2],type="l",col="olivedrab",lwd=2,lty="dotdash") }

    #labels of the full hour markers
    stui=substitute(szsi^{h},list(szsi=sz[si]+summert))
    yl=ang[mitte,2]+2.5
    if(sz[si]==12) {
      if(summert==1) { sozeText=ltext[12] } else { sozeText=ltext[11] }
      stui=paste(12+summert,"h ",ltext[13]," ",sozeText,sep="")
      if (suntype=="cart") {
        yl=ang[mitte,2]+4
      } else if (suntype=="polar") {
        yl=ang[mitte,2]+7
      }
    }
    if (suntype=="cart") {
      text(x=1.025*ang[mitte,1]-4,y=yl,labels=stui,cex=1.7,font=2)
    } else if (suntype=="polar") {
      text(x=(90-yl)*sin((1.025*ang[mitte,1]-4)*pi/180),y=(90-yl)*cos((1.025*ang[mitte,1]-4)*pi/180),labels=stui,cex=1.3,font=2)
    }
  }
}

#arc of the sun at one date for different days within a year
tagesbogen=function(suntype=type,jahr,lty="solid",lwd=2,col="steelblue",phi=phi,lambda=lambda,KAPPA=KAPPA,EPSILON=EPSILON,ALPHA=ALPHA) {
  tag=seq(0,24,length=24*60+1)
  for (jt in 1:length(jahr)) {
    tagbogen=coords(t=jahr[jt],S=tag,phi=phi,lambda=lambda,ignore=ieqot,KAPPA=KAPPA,EPSILON=EPSILON,ALPHA=ALPHA,tz=TZ)
    tagb=coord2angle(tagbogen,filterout=TRUE)
    sunlines(suntype=suntype,x=tagb[,1],y=tagb[,2],lty=lty,lwd=lwd,col=col)
  }
}

#highlight the position of the sun on a specific date and time as a red point
highlightpoint=function(suntype="cart",timeofday,date="2009-05-01",phi=phi,lambda=lambda,shift=c(0,-3),col="red",KAPPA=KAPPA,EPSILON=EPSILON,ALPHA=ALPHA,summert=0) {
  reddate=as.Date(date)
  dayofyear=as.numeric(reddate-as.Date("2009-01-01"))
  co=coords(t=dayofyear/365*2*pi,S=timeofday,phi=phi,lambda=lambda,ignore=ieqot,KAPPA=KAPPA,EPSILON=EPSILON,ALPHA=ALPHA,tz=TZ)
  winkel=coord2angle(co,filterout=TRUE)
  sunlines(suntype=type,x=winkel[,1],y=winkel[,2],type="p",lwd=2,col=col)
  if(summert==1) { timeofday=timeofday+1 }
  minofday=formatC(round((timeofday-floor(timeofday))*60), digits=0, width=2, format="f", flag="0")
  timestring=paste(floor(timeofday),":",minofday,sep="")
  if (suntype=="cart") {
    text(winkel+shift,paste(format(reddate,"%d. %b"),"\n",timestring),col=col,cex=1.4,adj=c(0.5,0.5))
  } else if (suntype=="polar") {
    pwinkel=winkel+shift
    text(x=(90-pwinkel[2])*sin(pwinkel[1]*pi/180),y=(90-pwinkel[2])*cos(pwinkel[1]*pi/180),paste(format(reddate,"%d. %b"),"\n",timestring),col=col,cex=1,adj=c(0.5,0.5))
  }
  print(winkel)
  return(winkel)
}

#function that handles both polar and cartesian coordinates
sunlines=function(suntype,x,y=NULL,...) {
  if (suntype=="cart") {
    lines(x,y, ...)
  } else if (suntype=="polar") {
    lines( x=(90-y)*sin(x*pi/180),y=(90-y)*cos(x*pi/180), ...)
  }
}

filename=paste("Sunchart-",type,"-",lang,"-",locationname,".",out,sep="")
if (out=="png") {
  CairoPNG(file=filename,width=1850,height=690)
  #png(file=filename,width=1850,height=690)
  #bitmap(file=filename,type="png16m",width=1850,height=690)
} else if (out=="pdf") {
  pdf(file=filename,paper="a4r",width=0,height=0)
  ##pdf(file=filename,width=(wgD+2*wgd)*pi/2.54,height=5/2.54)
} else if (out=="jpg") {
  #CairoJPEG(file=filename,width=1850,height=690)
  jpeg(file=filename,width=1850,height=690,quality=98)
} else if (out=="svg") {
  CairoSVG(file=filename,width=11,height=11)
}
xlab=c(paste(ltext[1],sep=""),paste(ltext[1],ltext[1],ltext[2],sep=""),paste(ltext[1],ltext[2],sep=""),paste(ltext[2],ltext[1],ltext[2],sep=""),paste(ltext[2],sep=""),paste(ltext[2],ltext[3],ltext[2],sep=""),paste(ltext[3],ltext[2],sep=""),paste(ltext[3],ltext[3],ltext[2],sep=""),paste(ltext[3],sep=""),paste(ltext[3],ltext[3],ltext[4],sep=""),paste(ltext[3],ltext[4],sep=""),paste(ltext[4],ltext[3],ltext[4],sep=""),paste(ltext[4],sep=""),paste(ltext[4],ltext[1],ltext[4],sep=""),paste(ltext[1],ltext[4],sep=""),paste(ltext[1],ltext[1],ltext[4],sep=""),paste(ltext[1],sep="") )

if (type=="cart") {
  plot(c(0,0),c(0,0),type="n",xlim=c(45,315),ylim=c(0,min(90-phi*180/pi+31,90)),xaxs="i",yaxs="i", axes=FALSE, main=ltext[14], cex.main=2.3, font.main=2, xlab=ltext[9], ylab=ltext[10], cex.lab=1.33)
  ##par(mar=c(0,0,0,0),cex=0.33)
  ##plot(c(0,0),c(0,0),type="n",xlim=c(0,360),ylim=c(-5,0),xaxs="i",yaxs="i", axes=FALSE)
  ##box("figure", col="blue",lwd=2)
  #par(mai=c(0.95625,0.76875,0.76875,0.39375))
  #box("figure", col="blue")
  legend(x=45,y=min(90-phi*180/pi+31,90),legend=location(lat=phi,long=lambda,name=locationname),box.col="white",bg="white",cex=1.7)


  xticks=seq(par("usr")[1],par("usr")[2],by=22.5)
  yticks=seq(par("usr")[3],par("usr")[4],by=10)
  axis(1, at=xticks[1:length(xticks)], tick=F, cex.axis=1.33, labels=xlab[3:15],font=2)
  ##axis(1, at=xticks[1:length(xticks)], tck=0.01, mgp=c(0,-1.5,0), cex.axis=1.75, labels=xlab[1:length(xticks)],font=2)
  axis(2, at=yticks, tick=F, cex.axis=1.5, labels=paste(yticks,"°",sep=""))
  grid( nx=length(xticks)-1,ny=NA,col="gray75")
  abline( h=yticks, col="gray75", lty="dotted")
  abline( v=c(90,180,270), col="gray20",lty="dotted")

  box(which="plot",col="grey50")
} else if (type=="polar") {
  polar.plot(length=NA,polar.pos=NA,rp.type="p",clockwise=TRUE,label.pos=seq(45,360+22.5,by=22.5),start=135,labels=xlab,radlab=F,radial.labels="",radial.lim=c(0,30,60,90),show.centroid=F, main=ltext[14], cex.main=2.3, font.main=2 )
  text(x=c(0,0,0,0),y=c(0,30,60,90),labels=c(ltext[15],"60°","30°",ltext[16]),col="darkgrey")
  legend("topleft",legend=location(lat=phi,long=lambda,name=locationname),box.col="white",bg="white",cex=1)
}

#arc on a day: birthdays
jahr=c(113)/365*2*pi
tagesbogen(suntype=type,jahr,lty=4,lwd=2,col="orange",phi=phi,lambda=lambda,KAPPA=KAPPA,EPSILON=EPSILON,ALPHA=ALPHA)

analemmabogen(suntype=type,phi=phi,lambda=lambda,KAPPA=KAPPA,EPSILON=EPSILON,ALPHA=ALPHA)

#daily arc: first half of the year
jahr=cumsum(c(0,31,28,31,30,31))/365*2*pi #one line per month
tagesbogen(suntype=type,jahr,lty="solid",lwd=2,col="steelblue",phi=phi,lambda=lambda,KAPPA=KAPPA,EPSILON=EPSILON,ALPHA=ALPHA)

#daily arc: second half of the year
jahr=cumsum(c(181,31,31,30,31,30))/365*2*pi #one line per month
tagesbogen(suntype=type,jahr,lty="dotted",lwd=2,col="skyblue3",phi=phi,lambda=lambda,KAPPA=KAPPA,EPSILON=EPSILON,ALPHA=ALPHA)

#one point per month, each at 12 o'clock
jp=cumsum(c(0,31,28,31,30,31,30,31,31,30,31,30))/365*2*pi #one line per month
jahresbogen=coords(t=jp,S=12,phi=phi,lambda=lambda,ignore=ieqot,KAPPA=KAPPA,EPSILON=EPSILON,ALPHA=ALPHA,tz=TZ)
angl=coord2angle(jahresbogen,filterout=TRUE)
sunlines(suntype=type,x=angl[,1],y=angl[,2],type="p",lwd=2)
adj=cbind(c(0.9,1,1.1,1.1,0,-0.2,1.2,1.1,-0.1,0,0,0.1),c(1.5,1.7,1.6,-0.2,1.3,1,-0.4,0.7,-0.3,-0.7,-0.7,-0.5))
for (i in 1:length(jp)) {
  if (type=="cart") {
    text(x=angl[i,1],y=angl[i,2],angle2date(jp[i]),adj=adj[i,],cex=1.33)
  } else if (type=="polar") {
    text(x=(90-angl[i,2])*sin(angl[i,1]*pi/180),y=(90-angl[i,2])*cos(angl[i,1]*pi/180),angle2date(jp[i]),adj=adj[i,],cex=0.7)
  }
}

#sun location on a certain day and time
hipo=highlightpoint(suntype=type,timeofday=13+25/60,date="2009-04-23",phi=phi,lambda=lambda,shift=c(0,-3),col="brown4",KAPPA=KAPPA,EPSILON=EPSILON,ALPHA=ALPHA,summert=0)

if (out=="png" | out=="jpg" | out=="svg" | out=="pdf") {
  dev.off()
  print(paste("output written to ",getwd(),"/",filename,sep=""))
}

###
###
## ev paar Zeilen rauf schieben, dient für sonneneinstrahlung abzuschätzen
sunlines(suntype=type,x=c(113,113+180),y=c(0,0),type="l",lwd=3,col="red")
# utitlity function to integrate (is sum up) the sun intensity over one day (and then to sum it up over a year)
besonnung_t=function(jahr) {
  tag=seq(0,24,length=60*24+1)
  tagbogen=coords(t=jahr,S=tag,phi=phi,lambda=lambda,ignore=ieqot,KAPPA=KAPPA,EPSILON=EPSILON,ALPHA=ALPHA)
  tagb=coord2angle(tagbogen,filterout=TRUE)
  resu=tagb[,2]
  resu[is.na(resu)]=0
  resu[tagb[,1] < (113.5) ]=0  #SüdWand noch nicht besonnt
  resu[tagb[,1] > (113.5+180) ]=0  #SüdWand nicht mehr besonnt
  return( mean(resu) )
}

# utitlity function to integrate (is sum up) the sun intensity over the whole year)
besonnung_j=function() {
  sonnensumme=0
  jahr=seq(0,2*pi/365,length=365)
  for (jt in 1:length(jahr)) {
    sonnensumme=sonnensumme+besonnung_t(jahr[jt])
  }
  return(sonnensumme/length(jahr))
}

besonnung_t(jahr=c(94)/365*2*pi)
besonnung_j()
###
###
Historique du fichier
Cliquer sur une date et heure pour voir le fichier tel qu'il était à ce moment-là.
| Date et heure | Vignette | Dimensions | Utilisateur | Commentaire | |
|---|---|---|---|---|---|
| actuel | 5 juillet 2009 à 15:47 | 1 805 × 685 (333 kio) | Thire | cairoPNG and other minor changes | |
| 17 mai 2009 à 14:20 | 1 805 × 685 (40 kio) | Thire | neue location, better code | ||
| 8 novembre 2008 à 02:01 | 1 805 × 685 (40 kio) | Thire | see code and description page for changes | ||
| 4 novembre 2008 à 20:51 | 1 800 × 680 (41 kio) | Thire | cols, lty, errors, red point one date/time, details. see descr (code) | ||
| 29 octobre 2008 à 22:35 | 1 800 × 680 (41 kio) | Thire | nice red point etc (see desciption page comments) | ||
| 26 octobre 2008 à 13:55 | 1 800 × 680 (43 kio) | Thire | now cols etc (see desc comments) | ||
| 20 octobre 2008 à 22:36 | 1 800 × 675 (35 kio) | Thire | now image: fat lines etc; new location | ||
| 19 octobre 2008 à 11:32 | 2 000 × 750 (44 kio) | Thire | now the new image... | ||
| 18 octobre 2008 à 16:43 | 1 480 × 530 (29 kio) | Thire | {{Information |Description= |Source= |Date= |Author= |Permission= |other_versions= }} | ||
| 18 octobre 2008 à 02:53 | 1 500 × 520 (27 kio) | Thire | {{Information |Description={{en|1=d}} {{de|1=d}} |Source=d |Author=d |Date= |Permission= |other_versions= }} <!--{{ImageUpload|full}}--> |
Utilisation du fichier
Les 2 pages suivantes utilisent ce fichier :
Usage global du fichier
Les autres wikis suivants utilisent ce fichier :
- Utilisation sur de.wikipedia.org