Fichier:Changes in glacial and ice cap mass balance (the amount of snow and ice contained in a glacier or an ice cap) for large regions (NOAA).png

Le contenu de la page n’est pas pris en charge dans d’autres langues.
Une page de Wikipédia, l'encyclopédie libre.

Fichier d’origine(758 × 668 pixels, taille du fichier : 45 kio, type MIME : image/png)

Ce fichier et sa description proviennent de Wikimedia Commons.

Description

Description
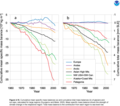
English: This image shows two graphs of changes in glacial and ice cap mass balance (the amount of snow and ice contained in a glacier or ice cap) for large regions (Europe, the Andes, the Arctic, Asian high mountains, North West USA and South West Canada, Alaska and coast mountains, and Patagonia). Graph (a) shows cumulative mean specific mass balances and graph balances of glaciers and ice caps, and (b) cumulative total mass balances of glaciers and ice caps. Mean specific mass balance shows the strength of climate change in the respective region. Total mass balance is the contribution from each region to sea level rise.

(a) plots time (1960 to ~2005) against cumulative mean specific mass balance, with most regions showing a decline in mass balance over time. (b) plots time (1960 to ~2005) against cumulative total mass balance, with most regions showing a decline in mass balance over time (see also retreat of glaciers since 1850). From the cited public-domain source (NOAA, 2010): "Indirect indicators of warming such as borehole temperatures, snow cover, and glacier recession data, are in substantial agreement with the more direct indicators of recent warmth. Evidence such as changes in glacial mass balance (the amount of snow and ice contained in a glacier) is useful since it not only provides qualitative support for existing meteorological data, but glaciers often exist in places too remote to support meteorological stations. The records of glacial advance and retreat often extend back further than weather station records, and glaciers are usually at much higher altitudes than weather stations, allowing scientists more insight into temperature changes higher in the atmosphere."

Further discussion of this topic can be found in the following source, which also refers to these two graphs: Lemke, P., J., et al. 2007: figure 4.15, in 4.5.2 Large and Global-Scale Analyses, in: Chapter 4: Observations: Changes in Snow, Ice and Frozen Ground. In: Climate Change 2007: The Physical Science Basis. Contribution of Working Group I to the Fourth Assessment Report of the Intergovernmental Panel on Climate Change (Solomon, S., et al., (eds.)). Cambridge University Press. Also available as a PDF (figure is shown on p.359).
Date
Source NOAA: NESDIS: NCDC: Frequently Asked Questions: Is the climate warming? Publisher: NOAA
Auteur NOAA
Autorisation
(Réutilisation de ce fichier)
Privacy Policy, Disclaimer, and Copyright Notice: ngdc.noaa.gov: "As required by 17 U.S.C. 403, third parties producing copyrighted works consisting predominantly of the material produced by U.S. government agencies must provide notice with such work(s) identifying the U.S. Government material incorporated and stating that such material is not subject to copyright protection within the United States. The information on government web pages is in the public domain and not subject to copyright protection within the United States unless specifically annotated otherwise (copyright may be held elsewhere). Foreign copyrights may apply."

Conditions d’utilisation

Public domain
Cette image est dans le domaine public car son contenu provient de la
National Oceanic and Atmospheric Administration
, réalisé par un employé dans le cadre de ses activités professionnelles.

العربية  čeština  Deutsch  Zazaki  English  español  eesti  suomi  français  hrvatski  magyar  italiano  日本語  한국어  македонски  മലയാളം  Plattdüütsch  Nederlands  polski  português  română  русский  sicilianu  slovenščina  Türkçe  Tiếng Việt  简体中文  繁體中文  +/−

Journal des téléversements d’origine

Date et heure Dimensions Utilisateur Commentaire
15 septembre 2012, 03:25:07 758 × 668 (42433 bytes) Enescot (d · contributions) {{Information |Description ={{en|1=This image shows two graphs of changes in glacial and [[:en:ice cap|ice cap]] mass balance (the amount of snow and ice contained in a [[:en:glacier|glacier]] or ice cap) for large regions ([[:en:Europe|Europe]], th...

Légendes

Ajoutez en une ligne la description de ce que représente ce fichier

Éléments décrits dans ce fichier

dépeint

image/png

d078e5ea66fb0a87fff3bc324d6177e713ac0db5

46 476 octet

668 pixel

758 pixel

Historique du fichier

Cliquer sur une date et heure pour voir le fichier tel qu'il était à ce moment-là.

Date et heureVignetteDimensionsUtilisateurCommentaire
actuel21 novembre 2014 à 10:04Vignette pour la version du 21 novembre 2014 à 10:04758 × 668 (45 kio)GifTaggerBot: Converting file to superior PNG file. (Source: [[File:Changes_in_glacial_and_ice_cap_mass_balance_(the_amount_of_snow_and_ice_contained_in_a_glacier_or_an_ice_cap)_for_large_regions_(NOAA).gif|Changes_in_glacial_and_ice_cap_mas...

La page suivante utilise ce fichier :