
Fichier:U.S. GDP - Real vs. Potential Per CBO Forecasts of 2007 and 2016.png
Fichier d’origine (1 005 × 459 pixels, taille du fichier : 21 kio, type MIME : image/png)
Ce fichier et sa description proviennent de Wikimedia Commons.
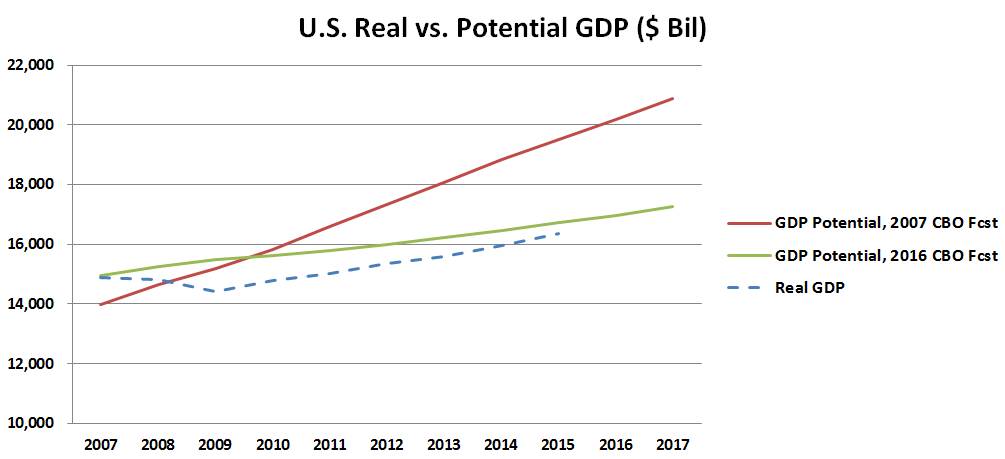
Understanding the chart
The chart compares two CBO projections of real potential GDP (the GDP amount the economy could theoretically produce at full employment) with actual real GDP. It shows how the Great Recession of 2007-2009 has impacted the trajectory. It is an updated version of a chart first presented by economist Lawrence Summers in February 2014 [1] and was more recently updated in a New York Times article by Neil Irwin in August, 2016.[2]
Description
| Description |
English: This chart compares U.S. potential GDP under two CBO forecasts (one from 2007 and one from 2016) versus the actual real GDP. It is based on a similar diagram from economist Larry Summers from 2014. |
| Date | |
| Source | Travail personnel |
| Auteur | Farcaster |
References
Conditions d’utilisation
- Vous êtes libre :
- de partager – de copier, distribuer et transmettre cette œuvre
- d’adapter – de modifier cette œuvre
- Sous les conditions suivantes :
- paternité – Vous devez donner les informations appropriées concernant l'auteur, fournir un lien vers la licence et indiquer si des modifications ont été faites. Vous pouvez faire cela par tout moyen raisonnable, mais en aucune façon suggérant que l’auteur vous soutient ou approuve l’utilisation que vous en faites.
- partage à l’identique – Si vous modifiez, transformez, ou vous basez sur cette œuvre, vous devez distribuer votre contribution sous la même licence ou une licence compatible avec celle de l’original.
Historique du fichier
Cliquer sur une date et heure pour voir le fichier tel qu'il était à ce moment-là.
| Date et heure | Vignette | Dimensions | Utilisateur | Commentaire | |
|---|---|---|---|---|---|
| actuel | 21 juillet 2016 à 04:26 | | 1 005 × 459 (21 kio) | Farcaster | User created page with UploadWizard |
Utilisation du fichier
Aucune page n’utilise ce fichier.
Usage global du fichier
Les autres wikis suivants utilisent ce fichier :
- Utilisation sur en.wikipedia.org
- Utilisation sur es.wikipedia.org
- Utilisation sur he.wikipedia.org
- Utilisation sur ja.wikipedia.org
- Utilisation sur ru.wikipedia.org