
Fichier:Michelsonmorley-boxplot.svg

Fichier d’origine (Fichier SVG, nominalement de 432 × 432 pixels, taille : 11 kio)
Ce fichier et sa description proviennent de Wikimedia Commons.
Description
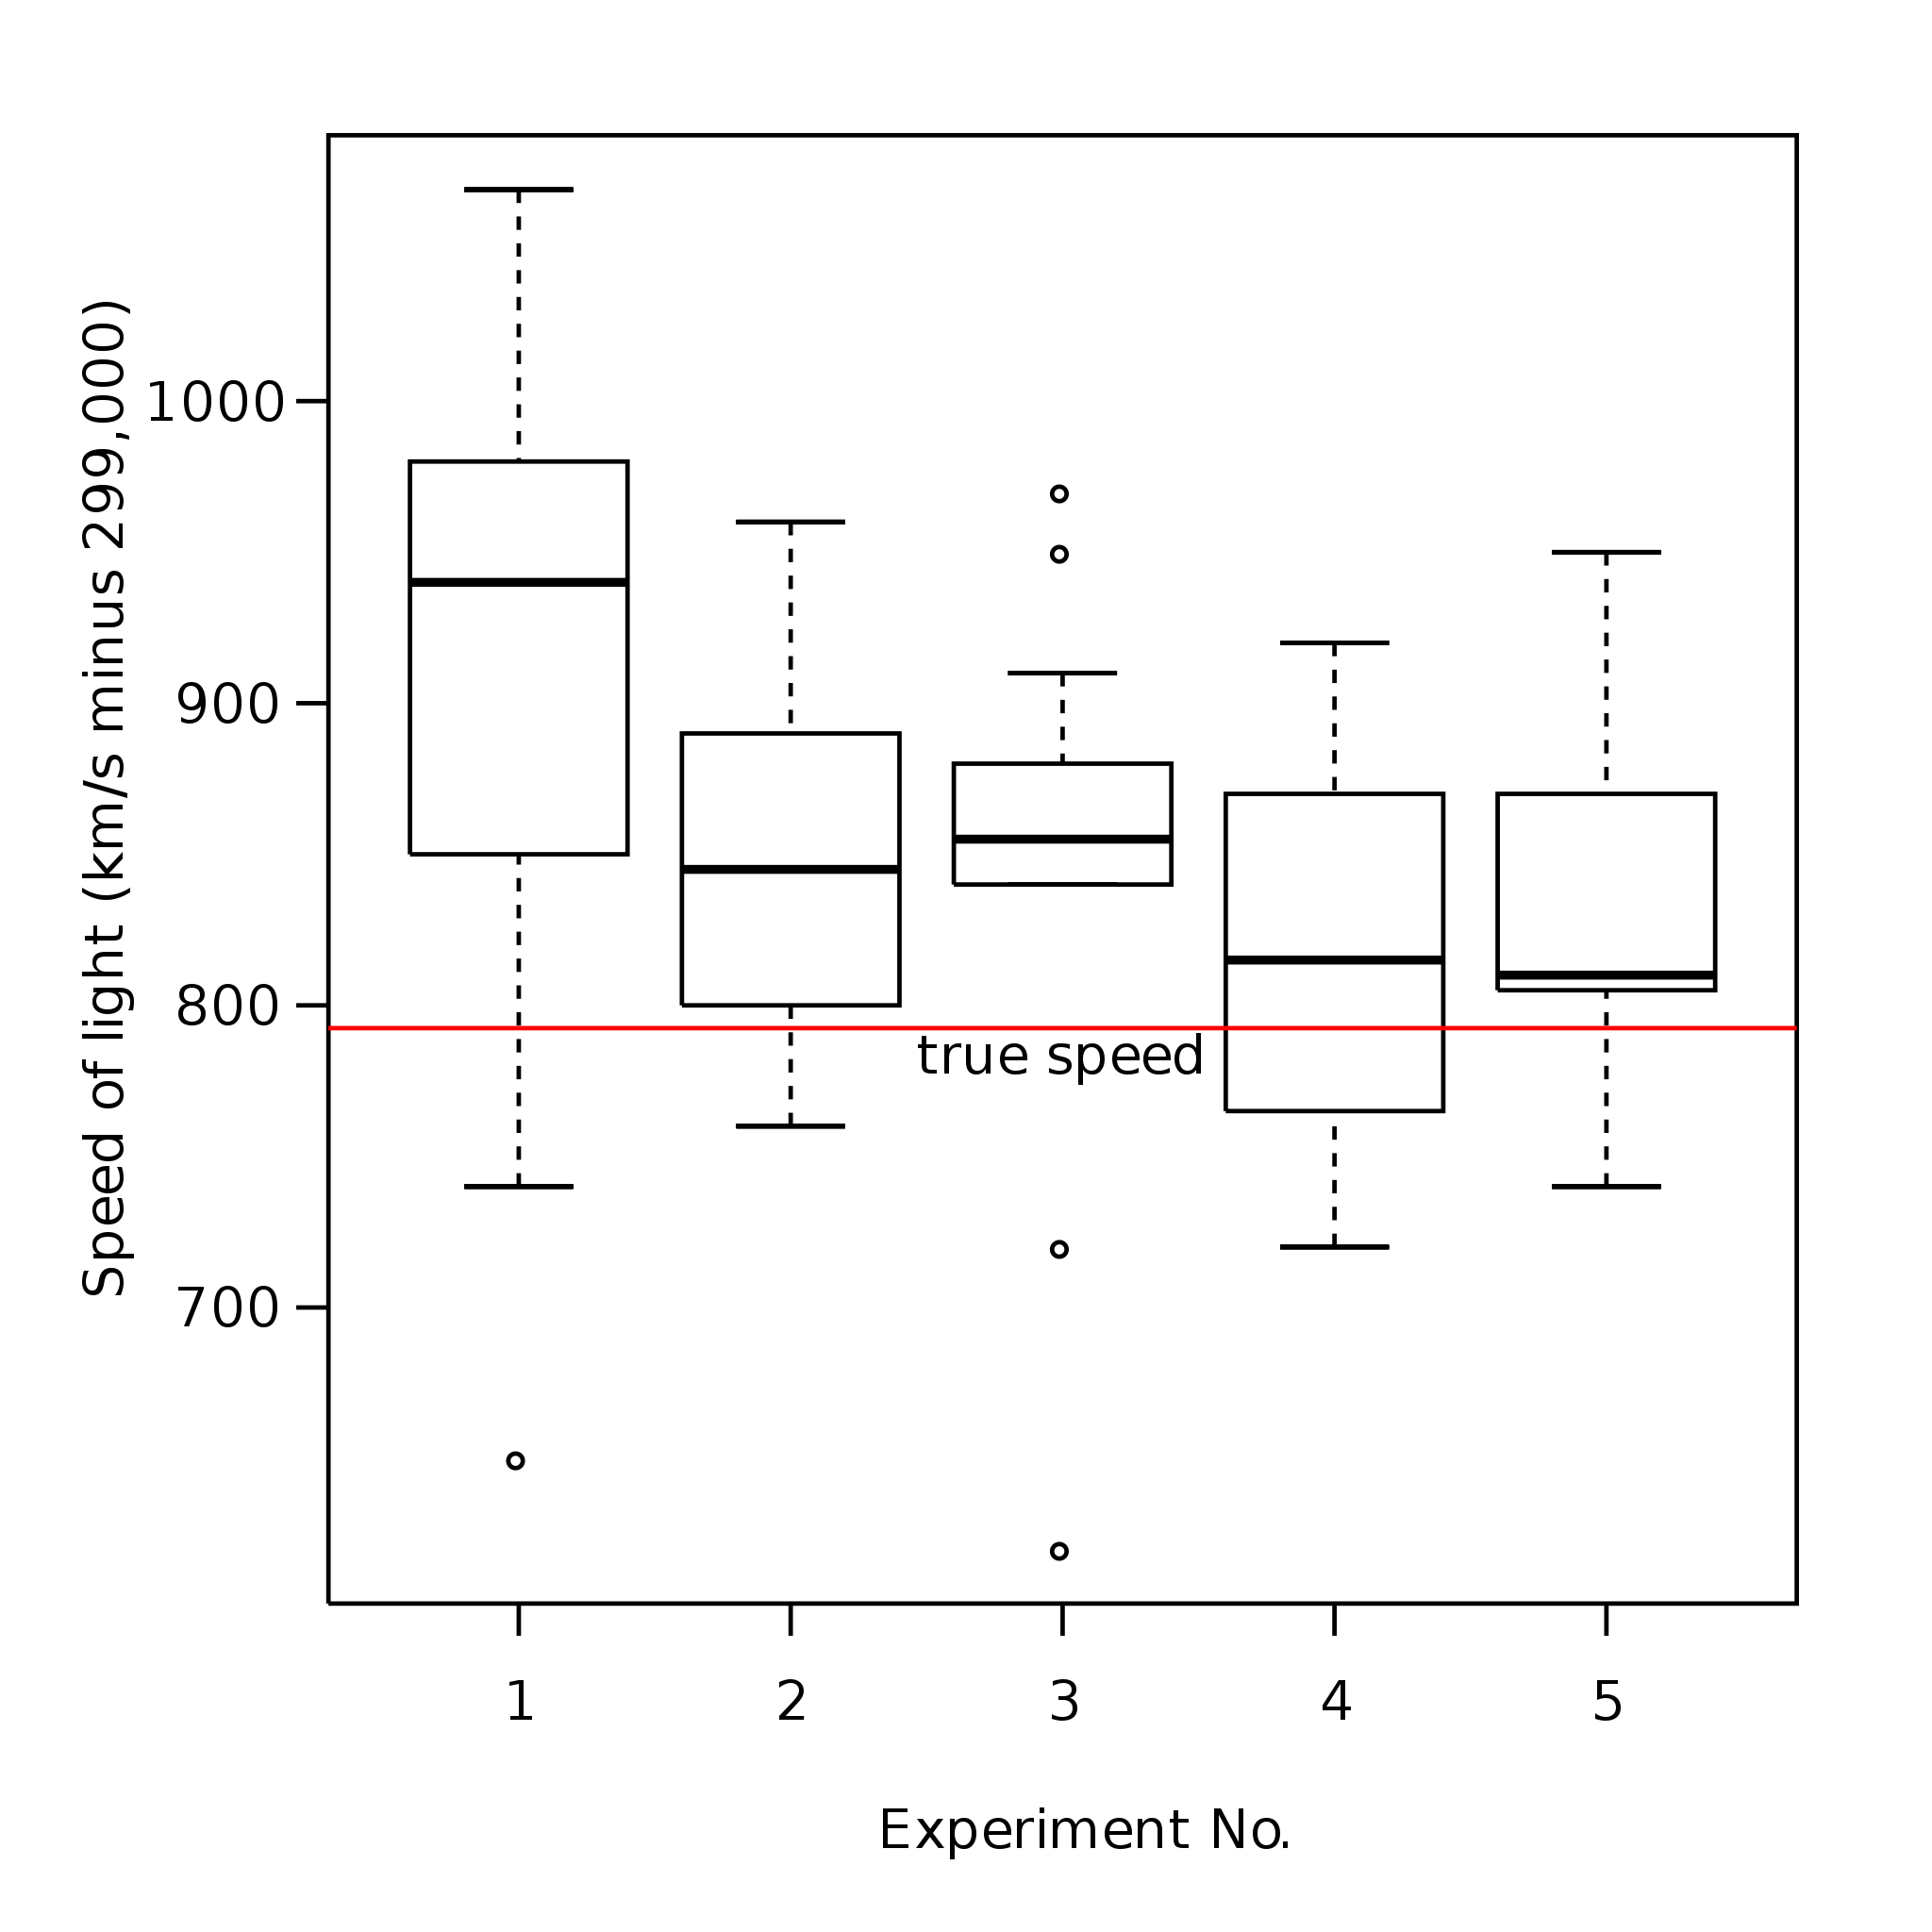
| Description | Boxplot representing Michelson's data on the speed of light. It consists of five experiments, each made of 20 consecutive runs. |
| Date | |
| Source | Travail personnel |
| Auteur | User:Schutz |
| SVG information |
This data is not from the Michelson-Morley experiment but from Michelson's measurement of the speed of light. See MICHELSON, A. A. (1882). Experimental determination of the velocity of light made at the United States Naval Academy, Annapolis. Astronomic Papers 1 pp. 109-145 U.S. Nautical Almanac Office, or S. M. Stigler (1977) Do robust estimators work with real data? Annals of Statistics 5, 1055–1098.
Original upload by User:Schutz
Boxplot representing Michelson's data on the speed of light. It consists of five experiments, each made of 20 consecutive runs. Note that the oblique line is incorrect, and probably due to a bug in the Mediawiki software/SVG converter. The graphic was created by User:Schutz for Wikipedia on 28 December 2006, using the R statistical project. The program that generated the graphic is given below; the data and the idea are from the R help page for the morley dataset (see help(morley)). The graph was exported in postscript format, converted to SVG using the pstoedit command, and the layout was slightly modified using Inkscape before upload.
  data(morley)
  morley$Expt <- factor(morley$Expt)
  morley$Run <- factor(morley$Run)
  attach(morley)

  postscript("Michelsonmorley-boxplot.ps", paper="special", height=6, width=6,
             horizontal=F)
  par(las=1)
  par(mar=c(5.1, 5.1, 2.1, 2.1))
  par(font=2)
  par(font.axis=2)
  boxplot(Speed ~ Expt, xlab = "Experiment No.", ylab="Speed of light (km/s minus 299,000)")
  abline(h=792.458, lty=3)
  dev.off()
New upload by User:Mwtoews
Boxplot representing Michelson's data on the speed of light. It consists of five experiments, each made of 20 consecutive runs.
The graphic was originally created by User:Schutz for Wikipedia on 28 December 2006, using the R statistical project. The program that generated the graphic is given below; the data and the idea are from the R help page for the morley dataset (see help(morley)). The graph was exported in PDF format, converted to SVG using Adobe Illustrator, and the layout was slightly modified using Vim before upload.
data(morley)
morley$Expt <- factor(morley$Expt)

pdf("Michelsonmorley-boxplot.pdf", height=6, width=6)
par(las=1, mar=c(5.1, 5.1, 2.1, 2.1))
boxplot(Speed ~ Expt, morley, xlab = "Experiment No.",
        ylab="Speed of light (km/s minus 299,000)")
abline(h=792.458, col="red")
text(3,792.458,"true\nspeed")
dev.off()
Conditions d’utilisation
| Moi, propriétaire des droits d’auteur sur cette œuvre, la place dans le domaine public. Ceci s'applique dans le monde entier. Dans certains pays, ceci peut ne pas être possible ; dans ce cas : J’accorde à toute personne le droit d’utiliser cette œuvre dans n’importe quel but, sans aucune condition, sauf celles requises par la loi. |
The creator and uploader also believes that this graphic is a trivial work which does not qualify for copyright.
Reference
- A. J. Weekes (1986) A Genstat Primer. London: Edward Arnold.
Historique du fichier
Cliquer sur une date et heure pour voir le fichier tel qu'il était à ce moment-là.
| Date et heure | Vignette | Dimensions | Utilisateur | Commentaire | |
|---|---|---|---|---|---|
| actuel | 3 mai 2008 à 12:25 | | 432 × 432 (11 kio) | Papa November | rm opaque bg. No copyright claimed for non-creative derivative work. |
| 30 octobre 2007 à 23:30 |  | 432 × 432 (11 kio) | Mwtoews | ||
| 30 octobre 2007 à 23:27 |  | 432 × 432 (11 kio) | Mwtoews | ||
| 30 octobre 2007 à 23:24 |  | 432 × 432 (12 kio) | Mwtoews | ||
| 28 décembre 2006 à 20:43 |  | 720 × 720 (19 kio) | Schutz |
Utilisation du fichier
Les 2 pages suivantes utilisent ce fichier :
Usage global du fichier
Les autres wikis suivants utilisent ce fichier :
- Utilisation sur ar.wikipedia.org
- Utilisation sur ca.wikipedia.org
- Utilisation sur cs.wikipedia.org
- Utilisation sur cy.wikipedia.org
- Utilisation sur da.wikipedia.org
- Utilisation sur el.wiktionary.org
- Utilisation sur en.wikipedia.org
- Summary statistics
- User:Rp
- Outlier
- Box plot
- Chart
- User:Andrevan
- User:Guaka
- User:M.e
- User:Jyril
- User:Peak Freak
- User:TMA~enwiki
- User:Val42
- User:Dreish
- User:Astronouth7303
- User:FuzzyBunny
- User:Wendell
- User:Kelisi
- User:Salix alba
- User:MichaelCaricofe
- User:NeonMerlin/boxes
- User:Kazikameuk
- User:Commander Nemet
- User:Emilio floris
- User:Burwellian
- User:Physicistjedi
- User:Bayerischermann
- User:Calilasseia
- User:ChildOfTheMoon83
- User:Hibernian
- User:Jcbarr
- User:Llewdor
- User:Richfife
- User:KnowledgeLord
- Data and information visualization
- Wikipedia:Userboxes/Mathematics
- User:Blarneytherinosaur/Userboxes
- User:Whitetigah
- User:TheObtuseAngleOfDoom/Userbox
- User:Estreya
- User:Faya/Userboxes
- User:Thistheman
- User:Rachel Ayres
- User:Drummmer42
Voir davantage sur l’utilisation globale de ce fichier.