
Fichier:Economics Gini coefficient2.svg

Taille de cet aperçu PNG pour ce fichier SVG : 500 × 500 pixels. Autres résolutions : 240 × 240 pixels | 480 × 480 pixels | 768 × 768 pixels | 1 024 × 1 024 pixels | 2 048 × 2 048 pixels.
Fichier d’origine (Fichier SVG, nominalement de 500 × 500 pixels, taille : 2 kio)
Ce fichier et sa description proviennent de Wikimedia Commons.
Description
| Description |
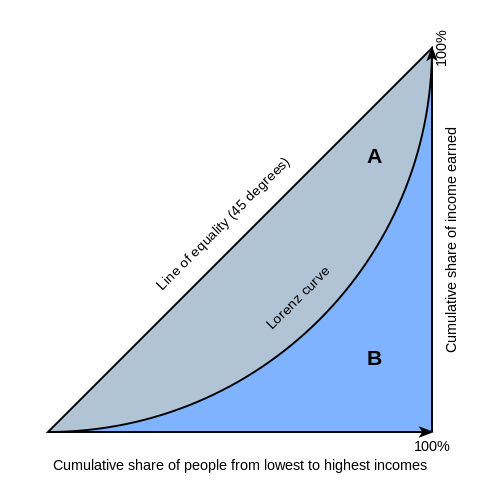
English: Gini coefficient diagram, based on the version by Bluemoose/BenFrantzDale. You can think of the horizontal axis as percent of people and the vertical axis as the percent of income those people receive. Therefore the Lorenz curves always start and end at the same places, where 0% of people make 0% of the country's income and 100% of people make 100% of the total income.
Inequality is implied when the curve is below the 45-degree line: At the left, the percentage of people is higher than the percent of income they receive (i.e. 10% of the people getting 5% of the total income); at the right, the percent of income received rises more than the percent of people receiving it. The area above the Lorenz curve -- marked "A" -- is shaded differently from the area below the curve -- marked "B". This simplifies the mathematical explanation of the gini coefficient, which is A/(A+B) |
| Date | |
| Source | The original file was on WikiMedia Commons (http://en.wikipedia.org/wiki/File:Economics_Gini_coefficient.svg). I have edited the file. |
| Auteur | Reidpath |
| Autres versions | Œuvres dérivées de ce fichier : Economics Gini coefficient2-ar.svg |
Conditions d’utilisation
Cette image est inéligible au droit d'auteur et est par conséquent dans le domaine public, parce qu’elle est intégralement constituée d’éléments qui font partie du patrimoine public et ne possèdent pas une originalité suffisante. Le texte en une fonte générique et les formes géométriques simples ne sont pas protégées par le droit d’auteur.
|
Historique du fichier
Cliquer sur une date et heure pour voir le fichier tel qu'il était à ce moment-là.
| Date et heure | Vignette | Dimensions | Utilisateur | Commentaire | |
|---|---|---|---|---|---|
| actuel | 6 mars 2021 à 20:00 | | 500 × 500 (2 kio) | Nyq | decapitalized common nouns |
| 20 mars 2016 à 18:52 |  | 500 × 500 (2 kio) | Wylve | Fixed CSS | |
| 20 mars 2016 à 18:51 |  | 500 × 500 (2 kio) | Wylve | Reduce tracing artifacts | |
| 24 juin 2009 à 17:18 |  | 500 × 500 (7 kio) | Reidpath | {{Information |Description={{en|1=Gini coefficient diagram, based on the version by Bluemoose/BenFrantzDale. You can think of the horizontal axis as percent of people and the vertical axis as the percent of income those people receive. Therefore the Loren |
Utilisation du fichier
Aucune page n’utilise ce fichier.
Usage global du fichier
Les autres wikis suivants utilisent ce fichier :
- Utilisation sur af.wikipedia.org
- Utilisation sur ar.wikipedia.org
- Utilisation sur bh.wikipedia.org
- Utilisation sur bn.wikipedia.org
- Utilisation sur en.wikipedia.org
- Gini coefficient
- Lorenz curve
- Poverty
- Portal:Mathematics/Featured picture archive
- Wikipedia:Reference desk/Archives/Humanities/2010 December 18
- Portal:Mathematics/Featured picture/2012 08
- Wikipedia:Village pump (technical)/Archive 106
- Portal:Mathematics/Selected picture
- Portal:Mathematics/Selected picture/11
- User:Lexsta/sandbox
- Utilisation sur et.wikipedia.org
- Utilisation sur fa.wikipedia.org
- Utilisation sur he.wikipedia.org
- Utilisation sur it.wikipedia.org
- Utilisation sur ja.wikipedia.org
- Utilisation sur km.wikipedia.org
- Utilisation sur la.wikipedia.org
- Utilisation sur ms.wikipedia.org
- Utilisation sur nl.wikipedia.org
- Utilisation sur ro.wikipedia.org
- Utilisation sur si.wikipedia.org
- Utilisation sur sq.wikipedia.org
- Utilisation sur sr.wikipedia.org
- Utilisation sur te.wikipedia.org
- Utilisation sur ur.wikipedia.org