
Fichier:Lawoflargenumbersanimation.gif
Pas de plus haute résolution disponible.
Lawoflargenumbersanimation.gif (100 × 169 pixels, taille du fichier : 50 kio, type MIME : image/gif, en boucle, 220 trames, 17 s)
Ce fichier et sa description proviennent de Wikimedia Commons.
Description
| Description |
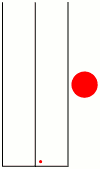
English: Simulation illustrating the Law of Large Numbers. Each frame, you flip a coin that is red on one side and blue on the other, and put a dot in the corresponding column. A pie chart notes the proportion of red and blue so far. Notice that the proportion varies a lot at first, but gradually approaches 50%. Animation made in Mathematica--I'm happy to give you the source code if you want to improve the animation or for any other reason. |
| Date | |
| Source | Travail personnel |
| Auteur | Sbyrnes321 |
Conditions d’utilisation
| Moi, propriétaire des droits d’auteur sur cette œuvre, la place dans le domaine public. Ceci s'applique dans le monde entier. Dans certains pays, ceci peut ne pas être possible ; dans ce cas : J’accorde à toute personne le droit d’utiliser cette œuvre dans n’importe quel but, sans aucune condition, sauf celles requises par la loi. |
(* Source code written in Mathematica 6.0, by Steve Byrnes, 2010. I release this code into the public domain. *)

SeedRandom[1]

NumBalls = 500;

(*Build list of point coordinates and radii*)

BuildCoordList[LeftX_, RightX_, BotY_, TopY_, Cols_, Rows_] :=
 Flatten[Table[{i, j}, {j, BotY, TopY, (TopY - BotY)/(Rows - 1)}, {i, LeftX, RightX, (RightX - LeftX)/(Cols - 1)}], 1];

BlueCoordsList = BuildCoordList[.15, .85, .15, 4.75, 5, 24];
RedCoordsList = BuildCoordList[1.15, 1.85, .15, 4.75, 5, 24];
radius = .05;

(*Draw borders*)

lines = {Line[{{0, 0}, {0, 5}}], Line[{{1, 0}, {1, 5}}],
   Line[{{2, 0}, {2, 5}}], Line[{{0, 0}, {2, 0}}]};

(*Draw pie chart*)

DrawPie[CenterX_, CenterY_, Radius_,
   FracRed_] := {{Red,
    Disk[{CenterX, CenterY}, Radius, {-FracRed \[Pi], FracRed \[Pi]}]}, {Blue,
     Disk[{CenterX, CenterY},
     Radius, {FracRed \[Pi], 2 \[Pi] - FracRed \[Pi]}]}};

(* Randomly generate order that red and blue appear *)

AppearOrder = Table[RandomInteger[{0, 1}], {i, 1, NumBalls}];

(* Calculate number of red and blue balls at any given time, and their proportions. *)

NumAppeared[time_] := Floor[time];
NumRed[time_] := Total[AppearOrder[[1 ;; NumAppeared[time]]]];
NumBlue[time_] := NumAppeared[time] - NumRed[time];
FracRed[time_] := NumRed[time]/NumAppeared[time];

(* Put everything together! *)

Video = {};
NumFrames = 220;
For[frame = 1, frame <= NumFrames, frame++,
  t = frame;
  ImageGraphicsList = lines;
  For[pt = 1, pt <= NumBlue[t], pt++,
   ImageGraphicsList = Append[ImageGraphicsList, {Blue, Disk[BlueCoordsList[[pt]], radius]}]];
  For[pt = 1, pt <= NumRed[t], pt++,
   ImageGraphicsList = Append[ImageGraphicsList, {Red, Disk[RedCoordsList[[pt]], radius]}]];
  ImageGraphicsList = Append[ImageGraphicsList, DrawPie[2.5, 2.5, .4, FracRed[t]]];
  Video = Append[Video, Graphics[ImageGraphicsList, ImageSize -> 100]];];

(* Slow the movie down at the beginning and end to make it easier to see *)
Video = Join[
   Table[Video[[1]], {i, 1, 3}], Table[Video[[2]], {i, 1, 3}], Table[Video[[3]], {i, 1, 3}],
   Table[Video[[4]], {i, 1, 3}], Table[Video[[5]], {i, 1, 3}], Table[Video[[6]], {i, 1, 2}],
   Table[Video[[7]], {i, 1, 2}], Table[Video[[8]], {i, 1, 2}], Table[Video[[9]], {i, 1, 2}],
   Table[Video[[10]], {i, 1, 2}], Video[[11 ;;]], Table[Video[[NumFrames]], {i, 1, 5}]];

(* Export *)
Export["test.gif", Video, "DisplayDurations" -> {14}, "AnimationRepititions" -> Infinity]
Historique du fichier
Cliquer sur une date et heure pour voir le fichier tel qu'il était à ce moment-là.
| Date et heure | Vignette | Dimensions | Utilisateur | Commentaire | |
|---|---|---|---|---|---|
| actuel | 25 mars 2010 à 21:30 | | 100 × 169 (50 kio) | Aiyizo | Optimized animation, converted to 32 color mode |
| 4 mars 2010 à 01:13 |  | 100 × 169 (477 kio) | Sbyrnes321 | longer simulation | |
| 27 février 2010 à 09:43 |  | 100 × 103 (172 kio) | Sbyrnes321 | {{Information |Description={{en|1=Simulation illustrating the Law of Large Numbers. Each frame, you flip a coin that is red on one side and blue on the other, and put a dot in the corresponding column. A pie chart notes the proportion of red and blue so f |
Utilisation du fichier
La page suivante utilise ce fichier :
Usage global du fichier
Les autres wikis suivants utilisent ce fichier :
- Utilisation sur el.wikipedia.org
- Utilisation sur en.wikipedia.org
- Utilisation sur en.wikiquote.org
- Utilisation sur fi.wikipedia.org
- Utilisation sur lv.wikipedia.org
- Utilisation sur sv.wikipedia.org
- Utilisation sur www.wikidata.org