Fichier:Ghg pie chart Turkey.svg

Le contenu de la page n’est pas pris en charge dans d’autres langues.
Une page de Wikipédia, l'encyclopédie libre.

Fichier d’origine(Fichier SVG, nominalement de 576 × 432 pixels, taille : 37 kio)

Ce fichier et sa description proviennent de Wikimedia Commons.

Description

Description
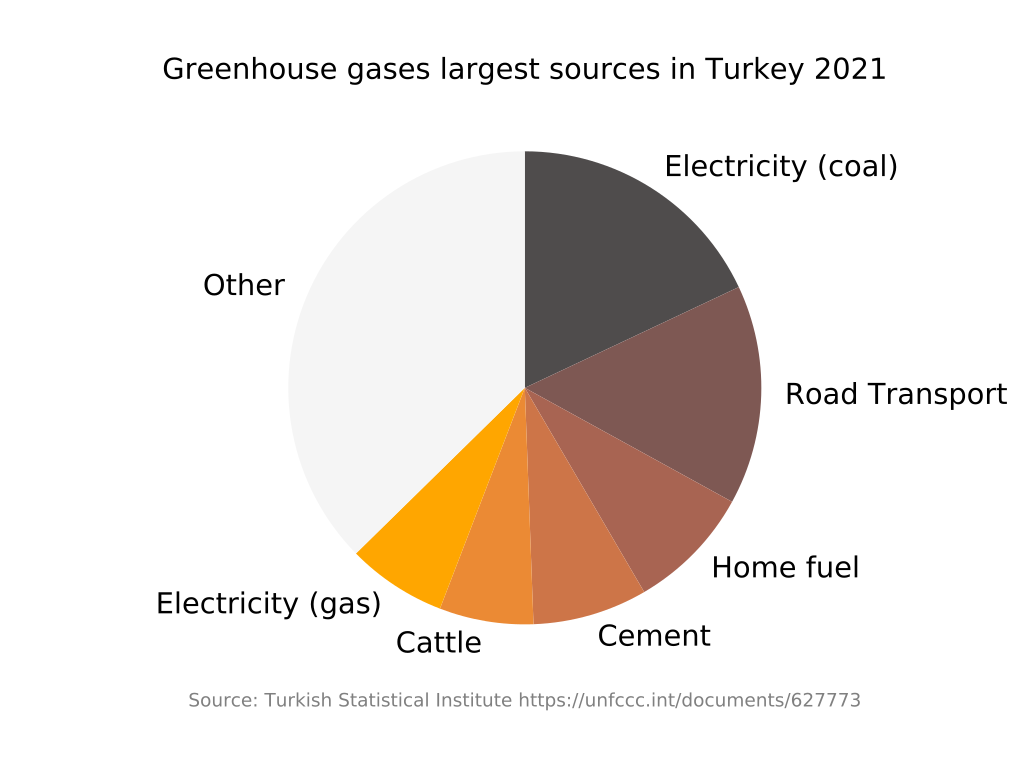
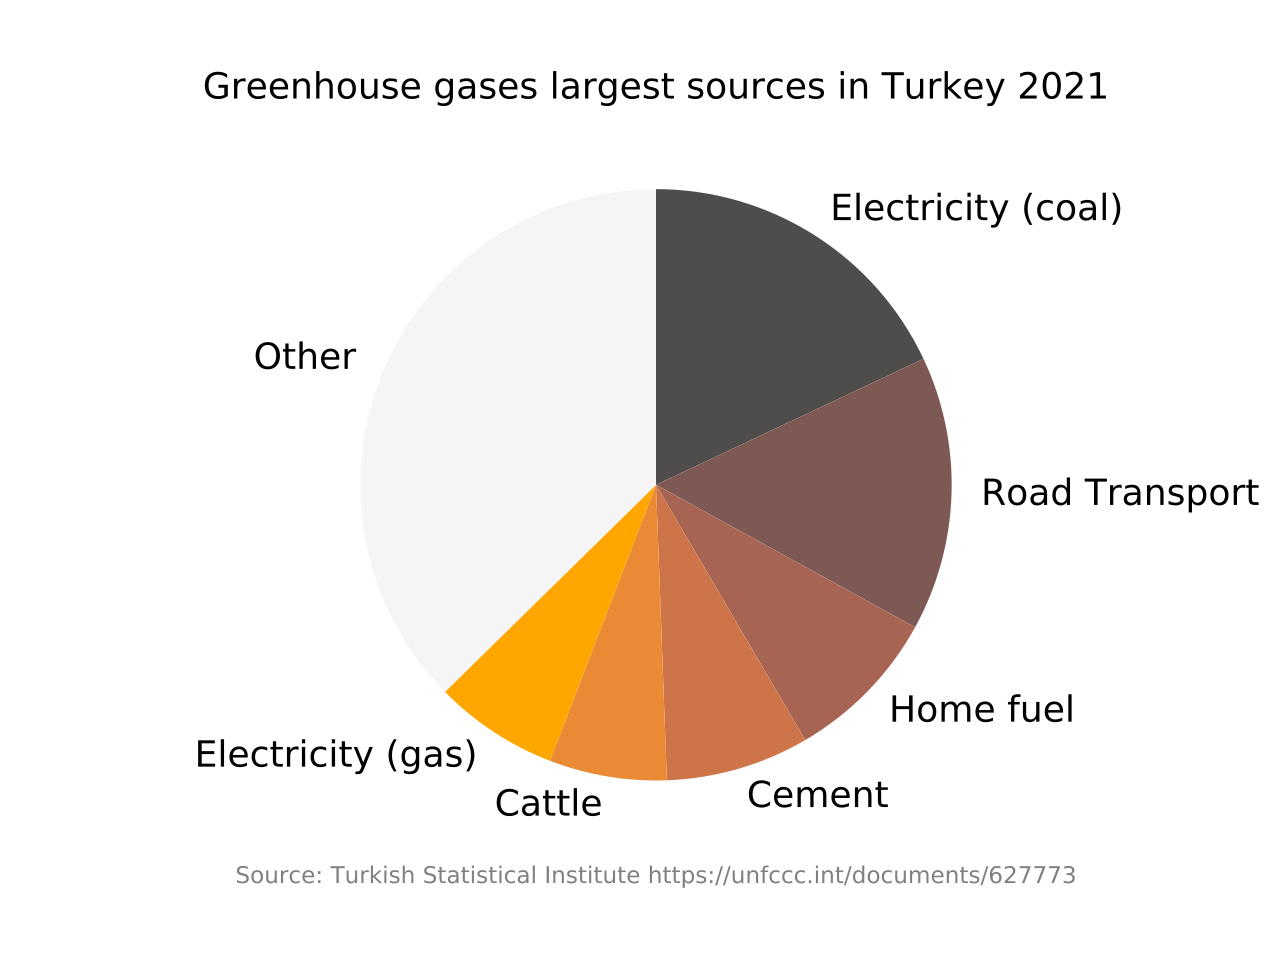
English: Greenhouse gas emissions by Turkey by source with English captions. For details of which spreadsheet cells the data is from see code comments. Turkish version at File:sera_gazlar_dairesel_grafik_Türkiye.svg
Source Travail personnel
Auteur Chidgk1
SVG information
InfoField
 
Le code de ce fichier SVG est valide.
 
Cette représentation graphique a été créée avec Matplotlib
Code source
InfoField

Python code

Source code
import logging 
# logging.basicConfig(level=logging.INFO) # can be commented out when not debugging

import matplotlib.pyplot as plt
import sys

lang = "en"
#lang = "tr"

#If text changed in future default size may chop off part of text so may need to set size
#fig = plt.figure(figsize=(width, height))
#fig = plt.figure(figsize=(6, 4))
fig = plt.figure()

# Set font size as default was a bit small to read
fontsize = 13

#Get current axes object
ax = fig.gca()

# Global warming potentials (GWP 100) to compare other gases with CO2 -
# from https://www.ipcc.ch/report/ar6/wg1/downloads/report/IPCC_AR6_WGI_Chapter_07_Supplementary_Material.pdf
# 7.SM.6 Tables of greenhouse gas lifetimes, radiative efficiencies and metrics

GWP_CH4 = 27.9
GWP_N2O = 273

data_source = 'https://unfccc.int/documents/627773'
#2021 data from  Turkey. 2023 Common Reporting Format (CRF) Table
#New data yearly so please update above url on 15 April 2024 from https://unfccc.int/process-and-meetings/transparency-and-reporting/reporting-and-review-under-the-convention/greenhouse-gas-inventories-annex-i-parties/national-inventory-submissions-2024
year = "2021"

# TABLE 1.A(a)  SECTORAL BACKGROUND DATA FOR ENERGY sheet 1
# Electricity Generation Solid Fuels
# kt CO2
# Current spreadsheet cell G33 (G26 includes Combined Heat and Power)
Electricity_coal = 101558.02

# Electricity Generation Gaseous Fuels
# G34 (G27 includes Combined Heat and Power)
Electricity_gas = 38456.40

# sheet 3  Road transportation
# G19 (cars have row G27 below but there is no data in it - check next year data when it comes)
Road_transport = 84698.63

# sheet 4  Commercial/institutional energy G16
Work_buildings = 13895.30

# sheet 4  Residential G30
Home_fuel = 48408.50

# TABLE 2(I).A-H sheet 1  SECTORAL BACKGROUND DATA FOR  INDUSTRIAL PROCESSES AND PRODUCT USE
# G10 (cement production)
Cement = 44226.79

# TABLE 3.A SECTORAL BACKGROUND DATA FOR AGRICULTURE F9 Enteric fermentation 1.   Cattle
Cattle_enteric_fermentation = 1091.60 * GWP_CH4 # Convert methane to CO2eq

# TABLE 3.B(a) SECTORAL BACKGROUND DATA FOR AGRICULTURE
# J9 for CH4
# TABLE 3.B(b) SECTORAL BACKGROUND DATA FOR AGRICULTURE
# T10 for N2O
# Manure management 1.    Cattle
Cattle_manure = (144.97 * GWP_CH4) + (6.47 * GWP_N2O) 

Cattle = Cattle_enteric_fermentation + Cattle_manure

# Total without LULUCF from National Inventory Report or elsewhere
total_Mt = 564.4
total = total_Mt * 1000

logging.info('%s Electricity_coal', Electricity_coal)
logging.info('%s Road_transport', Road_transport)
logging.info('%s Home_fuel', Home_fuel)
logging.info('%s Cement', Cement)
logging.info('%s Cattle', Cattle)

Other = total - (Electricity_coal + Road_transport + Cattle + Home_fuel + Cement + Electricity_gas)

#Put in order of size to make easier to compare
percents = [Electricity_coal,    Road_transport, Home_fuel, Cement, Cattle, Electricity_gas, Other]

# From https://learnui.design/tools/data-color-picker.html#palette
colors = ['#4f4c4c', '#7e5853', '#a86452', '#cd7548', '#eb8a34', '#ffa600', 'whitesmoke']
# Or you can use color names like:
#colors = ['peru'               ,'grey'      ,'pink'       ,'lightgrey','orange','khaki'          ,'whitesmoke']


if lang == "en":
 plt.title ("Greenhouse gases largest sources in Turkey " + year, fontsize = fontsize)
 autopct='%1.0f%%' # % sign after number in English
 labels = ['Electricity (coal)','Road Transport','Home fuel','Cement','Cattle','Electricity (gas)','Other']
 data_source = 'Source: Turkish Statistical Institute ' + data_source
elif lang == "tr":
 plt.title (year + " Türkiye'de sera gazı emisyon kaynakları",  fontsize = fontsize)
 autopct='%%%1.0f' # % sign before number in Turkish
 labels = ['Kömürden Elektriği', 'Karayolu Ulaşim',  'Evler',    'Çimento','Sığırlar','Doğalgazdan Elektriği', 'Diğer']
 data_source = 'Kaynak: Türkiye İstatistik Kurumu ' + data_source
else:
 print("Unknown language " + lang)
 sys.exit()
plt.xlabel(data_source, fontsize = 'small', color = 'grey')

ax.pie(percents, labels=labels, textprops={'fontsize': fontsize}, colors=colors, counterclock=False, startangle=90)
# Or if you want percents use below but that also puts % on the "other" slice
#ax.pie(percents, labels=labels, textprops={'fontsize': 10}, colors=colors, autopct=autopct, counterclock=False, startangle=90)

if lang == "en":
 plt.savefig('ghg_pie_chart_Turkey.svg')
elif lang == "tr":
 plt.savefig('sera_gazlar_dairesel_grafik_Türkiye.svg')
else:
 print("Unknown language " + lang)
 sys.exit()  

plt.show()

Conditions d’utilisation

Moi, en tant que détenteur des droits d’auteur sur cette œuvre, je la publie sous la licence suivante :
w:fr:Creative Commons
paternité partage à l’identique
Vous êtes libre :
  • de partager – de copier, distribuer et transmettre cette œuvre
  • d’adapter – de modifier cette œuvre
Sous les conditions suivantes :
  • paternité – Vous devez donner les informations appropriées concernant l'auteur, fournir un lien vers la licence et indiquer si des modifications ont été faites. Vous pouvez faire cela par tout moyen raisonnable, mais en aucune façon suggérant que l’auteur vous soutient ou approuve l’utilisation que vous en faites.
  • partage à l’identique – Si vous modifiez, transformez, ou vous basez sur cette œuvre, vous devez distribuer votre contribution sous la même licence ou une licence compatible avec celle de l’original.

Légendes

Ajoutez en une ligne la description de ce que représente ce fichier
Greenhouse gas emissions by Turkey by source

Éléments décrits dans ce fichier

dépeint

image/svg+xml

Historique du fichier

Cliquer sur une date et heure pour voir le fichier tel qu'il était à ce moment-là.

Date et heureVignetteDimensionsUtilisateurCommentaire
actuel15 avril 2023 à 10:18Vignette pour la version du 15 avril 2023 à 10:18576 × 432 (37 kio)Chidgk1updated to 2021
15 avril 2022 à 11:45Vignette pour la version du 15 avril 2022 à 11:45576 × 432 (39 kio)Chidgk1updated to 2020 and various other changes
14 novembre 2019 à 08:48Vignette pour la version du 14 novembre 2019 à 08:48576 × 432 (38 kio)Chidgk1Increased font size slightly
14 novembre 2019 à 08:42Vignette pour la version du 14 novembre 2019 à 08:42576 × 432 (38 kio)Chidgk1increased font size slightly to make more readable
19 octobre 2019 à 15:12Vignette pour la version du 19 octobre 2019 à 15:12576 × 432 (38 kio)Chidgk1Labels on outside so we can read more easily <code><nowiki> import matplotlib.pyplot as plt # Pie chart labels = 'Electricity (coal)','Road Transport','Agriculture','Cement' ,'Homes','Electricity (gas)','Work buildings','Iron and steel','Waste' ,'Other' sizes = [19, 15, 14, 10, 8, 7, 4, 4, 3, 16] colors = ['peru' ,'grey' ,'pink' ,'lightgrey','orange','lightyellow' ,'khaki' ,'lightblue' ,'lightgreen','whitesmoke'] fig1, ax1 = plt.subplots()...
17 avril 2019 à 09:03Vignette pour la version du 17 avril 2019 à 09:03600 × 467 (78 kio)Chidgk1added waste
16 avril 2019 à 19:33Vignette pour la version du 16 avril 2019 à 19:33600 × 467 (72 kio)Chidgk1Added iron and steel
16 avril 2019 à 15:32Vignette pour la version du 16 avril 2019 à 15:32600 × 467 (63 kio)Chidgk1Updated for 2017 stats just released. Now produced with Google Charts as easier.
4 avril 2019 à 08:00Vignette pour la version du 4 avril 2019 à 08:001 080 × 1 080 (39 kio)Chidgk1Increased font size to 25
21 mars 2019 à 08:12Vignette pour la version du 21 mars 2019 à 08:121 080 × 1 080 (39 kio)Chidgk1User created page with UploadWizard

La page suivante utilise ce fichier :

Usage global du fichier

Les autres wikis suivants utilisent ce fichier :

Métadonnées