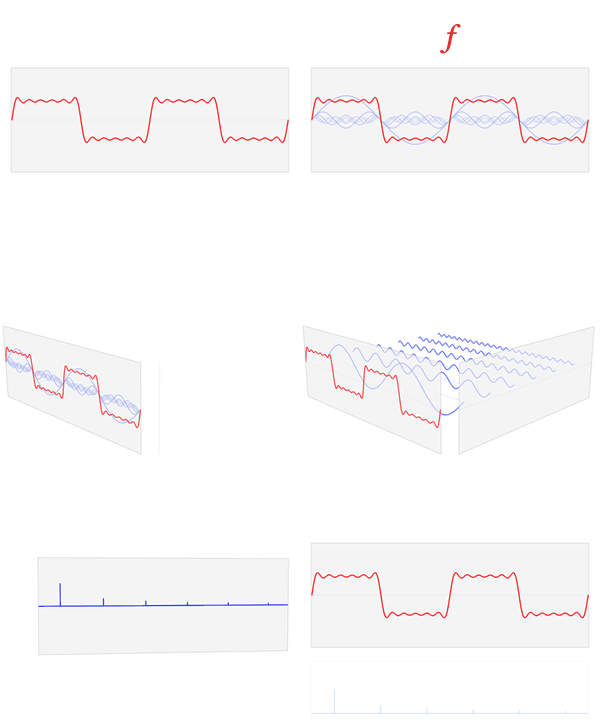
Fichier:Fourier transform time and frequency domains.gif
Fourier_transform_time_and_frequency_domains.gif (500 × 400 pixels, taille du fichier : 399 kio, type MIME : image/gif, en boucle, 93 trames, 37 s)
Historique du fichier
Cliquer sur une date et heure pour voir le fichier tel qu'il était à ce moment-là.
| Date et heure | Vignette | Dimensions | Utilisateur | Commentaire | |
|---|---|---|---|---|---|
| actuel | 23 février 2013 à 22:42 |  | 500 × 400 (399 kio) | LucasVB | Reverted to version as of 20:31, 23 February 2013 |
| 23 février 2013 à 22:38 |  | 500 × 400 (684 kio) | LucasVB | Trying to circumvent MediaWiki's crappy thumbnail generator again. Completely unoptimized the animation. | |
| 23 février 2013 à 22:31 |  | 500 × 400 (399 kio) | LucasVB | The new GIF scaling algorithm used on MediaWiki is awful, and adds a bunch of horrible artifacts to the animated thumbs. This is an attempt at avoiding the artifacts using an alternate palette. If this doesn't work, I'll have to submit the smaller vers... | |
| 23 février 2013 à 13:43 |  | 500 × 400 (346 kio) | LucasVB | {{Information |Description=A visualization of the relationship between the time domain and the frequency domain of a function, based on its Fourier transform. |Source={{own}} |Date=2013-02-23 |Author= Lucas V. Barbosa |Permission={{PD-... |
Utilisation du fichier
La page suivante utilise ce fichier :
Usage global du fichier
Les autres wikis suivants utilisent ce fichier :
- Utilisation sur ar.wikipedia.org
- Utilisation sur bn.wikipedia.org
- Utilisation sur en.wikipedia.org
- Utilisation sur en.wikiversity.org
- Utilisation sur eu.wikipedia.org
- Utilisation sur hi.wikipedia.org
- Utilisation sur ru.wikipedia.org
- Utilisation sur www.wikidata.org


