
Fichier:BMI-30-Worldmap-2014.svg

Taille de cet aperçu PNG pour ce fichier SVG : 800 × 382 pixels. Autres résolutions : 320 × 153 pixels | 640 × 306 pixels | 1 024 × 489 pixels | 1 280 × 612 pixels | 2 560 × 1 223 pixels | 1 620 × 774 pixels.
Fichier d’origine (Fichier SVG, nominalement de 1 620 × 774 pixels, taille : 470 kio)
Ce fichier et sa description proviennent de Wikimedia Commons.
Description
| Description |
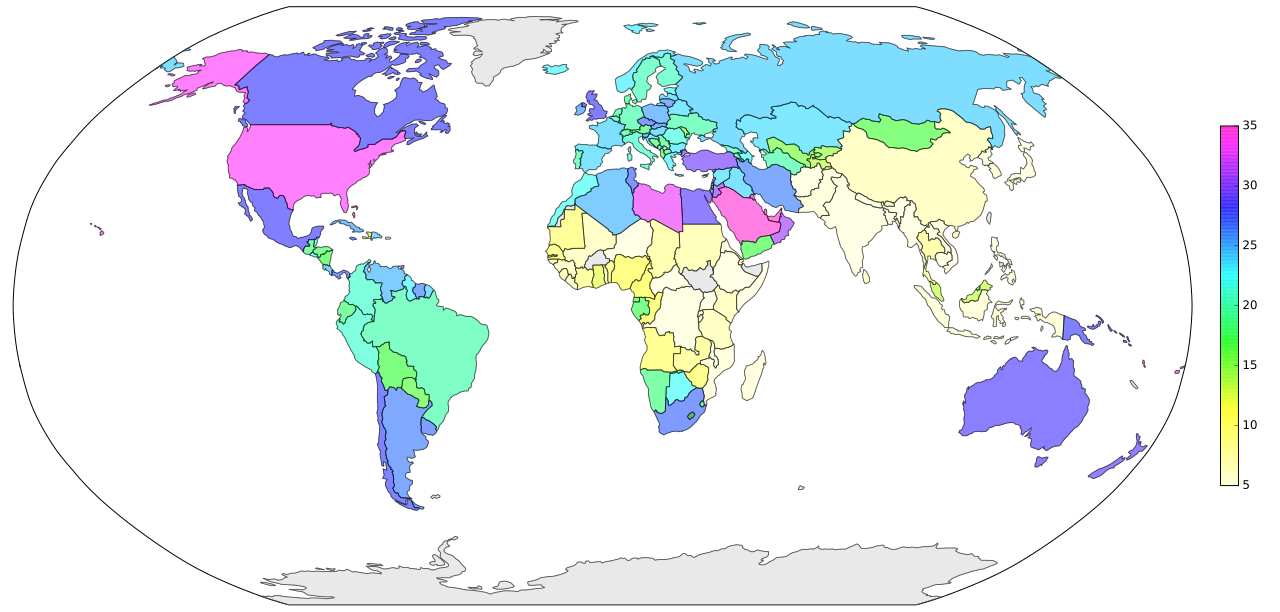
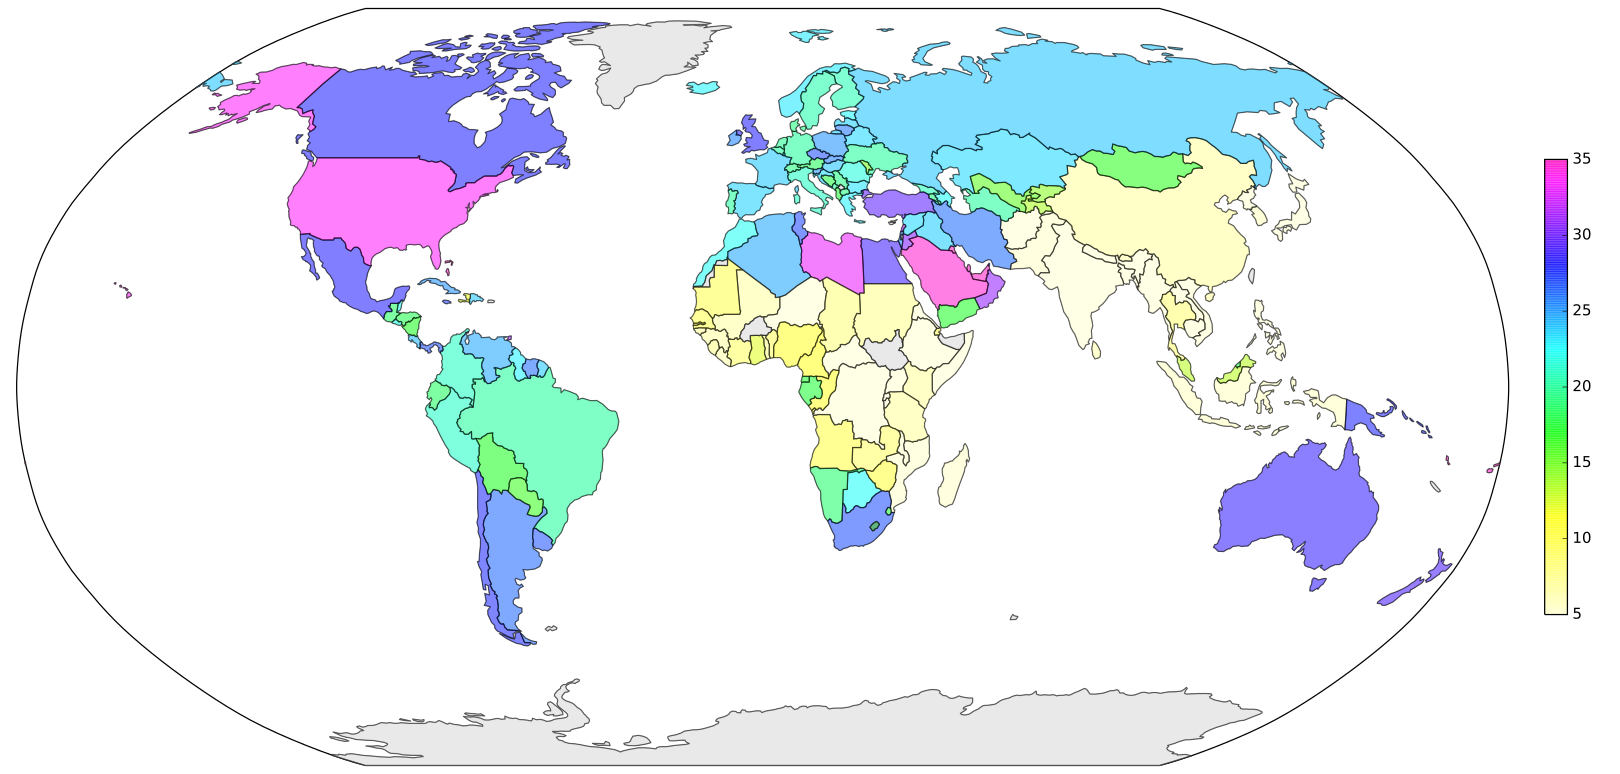
English: Percentage of people with a body mass index ≥ 30kg/m2 per country in 2014
Data from http://www.who.int/gho/ncd/risk_factors/overweight/en/ http://obesity.procon.org/view.resource.php?resourceID=006032 Country shapes from http://www.naturalearthdata.com/downloads/110m-cultural-vectors Created with Python and Matplotlib Basemap Toolkit. |
| Date | |
| Source | Travail personnel |
| Auteur | MagHoxpox |
"""
Percentage of people with a body mass index >= 30kg/m^2 per country in 2014
Country shapes from http://www.naturalearthdata.com/downloads/110m-cultural-vectors/
"""

import numpy as np
from mpl_toolkits.basemap import Basemap
import matplotlib.pyplot as plt
from matplotlib.patches import Polygon, PathPatch
from matplotlib.collections import PatchCollection
from matplotlib.colors import LinearSegmentedColormap

#########################################################################################
# read values from data in wiki-table format
data = "".join(open("bmi30-wiki.txt").readlines())
data = data.replace("\n", "").replace("{","").replace("}","").replace("%","").replace(".","").replace(",",".").split("|-")[1:]
value={}
for line in data:
    line = line.split("|")
    val=float(line[3])
    key = line[2]
    value[key]=val

#########################################################################################
# draw empty worldmap
fig = plt.figure(figsize=(18,8.6))
plt.subplots_adjust(left=0.01, bottom=0.01, right=1.12, top=0.99)

m = Basemap(projection='robin',lon_0=0, llcrnrlat=-60,urcrnrlat=85, llcrnrlon=-180, urcrnrlon=180, resolution='l')
m.drawmapboundary()

#########################################################################################
# color country shapes
m.readshapefile('ne_110m_admin_0_countries/ne_110m_admin_0_countries', name='world', drawbounds=True, color='gray')

countries = []
undefined_countries = []
valueList  = []
lastValues = []
for info, shape in zip(m.world_info, m.world):
    try:
        key = info["ADM0_A3"]
        val = value[key]
    except KeyError:
        undefined_countries.append(Polygon(np.array(shape), True))
        continue

    pol = Polygon(np.array(shape), True)

    # Workaround: the inner borders of South Africa to Lesotho are missing.
    if key=="LSO":
        lastValues.append((pol, val))
    else:
        countries.append(pol)
        valueList.append(val)

for pol, val in lastValues:
    countries.append(pol)
    valueList.append(val)

valueArray = np.array(valueList)
print valueArray.min(), valueArray.max()
ticks = np.linspace(5, 35,7)

#########################################################################################
# colorbar, modified "gist_rainbow" theme
_gist_rainbow_data = (
        (0.000, (1.00, 1.00, 0.80)),
        #(0.030, (1.00, 0.00, 0.00)),
        (0.215, (1.00, 1.00, 0.00)),
        (0.400, (0.00, 1.00, 0.00)),
        (0.586, (0.00, 1.00, 1.00)),
        (0.770, (0.00, 0.00, 1.00)),
        (0.954, (1.00, 0.00, 1.00)),
        (1.000, (1.00, 0.00, 0.75)))
cm = LinearSegmentedColormap.from_list("cm", _gist_rainbow_data, 256)
p = PatchCollection(countries, alpha=0.5,  zorder=3, cmap=cm)
p.set_array(valueArray)
p.set_clim([ticks.min(), ticks.max()])

plt.gca().add_collection(p)
cb = fig.colorbar(p, ticks = ticks, shrink=0.6, pad = 0.02, drawedges=False)
cb.solids.set_edgecolor("face")

#########################################################################################
# set countries without data to lightgray
p2 = PatchCollection(undefined_countries, alpha=0.5,  zorder=3, cmap=LinearSegmentedColormap.from_list("lg", ["lightgray", "lightgray"]))
p2.set_array(np.ones((len(undefined_countries),)))
plt.gca().add_collection(p2)

#########################################################################################
# save and show
filename = "BMI-30-Worldmap-2014"
plt.savefig(filename + ".svg")

plt.show()
Conditions d’utilisation
Moi, en tant que détenteur des droits d’auteur sur cette œuvre, je la publie sous la licence suivante :
Ce fichier est sous la licence Creative Commons Attribution – Partage dans les Mêmes Conditions 4.0 International.
- Vous êtes libre :
- de partager – de copier, distribuer et transmettre cette œuvre
- d’adapter – de modifier cette œuvre
- Sous les conditions suivantes :
- paternité – Vous devez donner les informations appropriées concernant l'auteur, fournir un lien vers la licence et indiquer si des modifications ont été faites. Vous pouvez faire cela par tout moyen raisonnable, mais en aucune façon suggérant que l’auteur vous soutient ou approuve l’utilisation que vous en faites.
- partage à l’identique – Si vous modifiez, transformez, ou vous basez sur cette œuvre, vous devez distribuer votre contribution sous la même licence ou une licence compatible avec celle de l’original.
Historique du fichier
Cliquer sur une date et heure pour voir le fichier tel qu'il était à ce moment-là.
| Date et heure | Vignette | Dimensions | Utilisateur | Commentaire | |
|---|---|---|---|---|---|
| actuel | 6 janvier 2018 à 12:17 | | 1 620 × 774 (470 kio) | MagHoxpox | User created page with UploadWizard |
Utilisation du fichier
Aucune page n’utilise ce fichier.
Usage global du fichier
Les autres wikis suivants utilisent ce fichier :
- Utilisation sur de.wikipedia.org