
Fichier:2017 AQAL Capital and Tom Schulz variwide chart "Worldwide Co2 emissions".png
Taille de cet aperçu : 800 × 519 pixels. Autres résolutions : 320 × 208 pixels | 640 × 415 pixels | 1 024 × 664 pixels | 1 280 × 830 pixels | 2 560 × 1 660 pixels | 3 315 × 2 150 pixels.
Fichier d’origine (3 315 × 2 150 pixels, taille du fichier : 235 kio, type MIME : image/png)
Ce fichier et sa description proviennent de Wikimedia Commons.
Description
| Description |
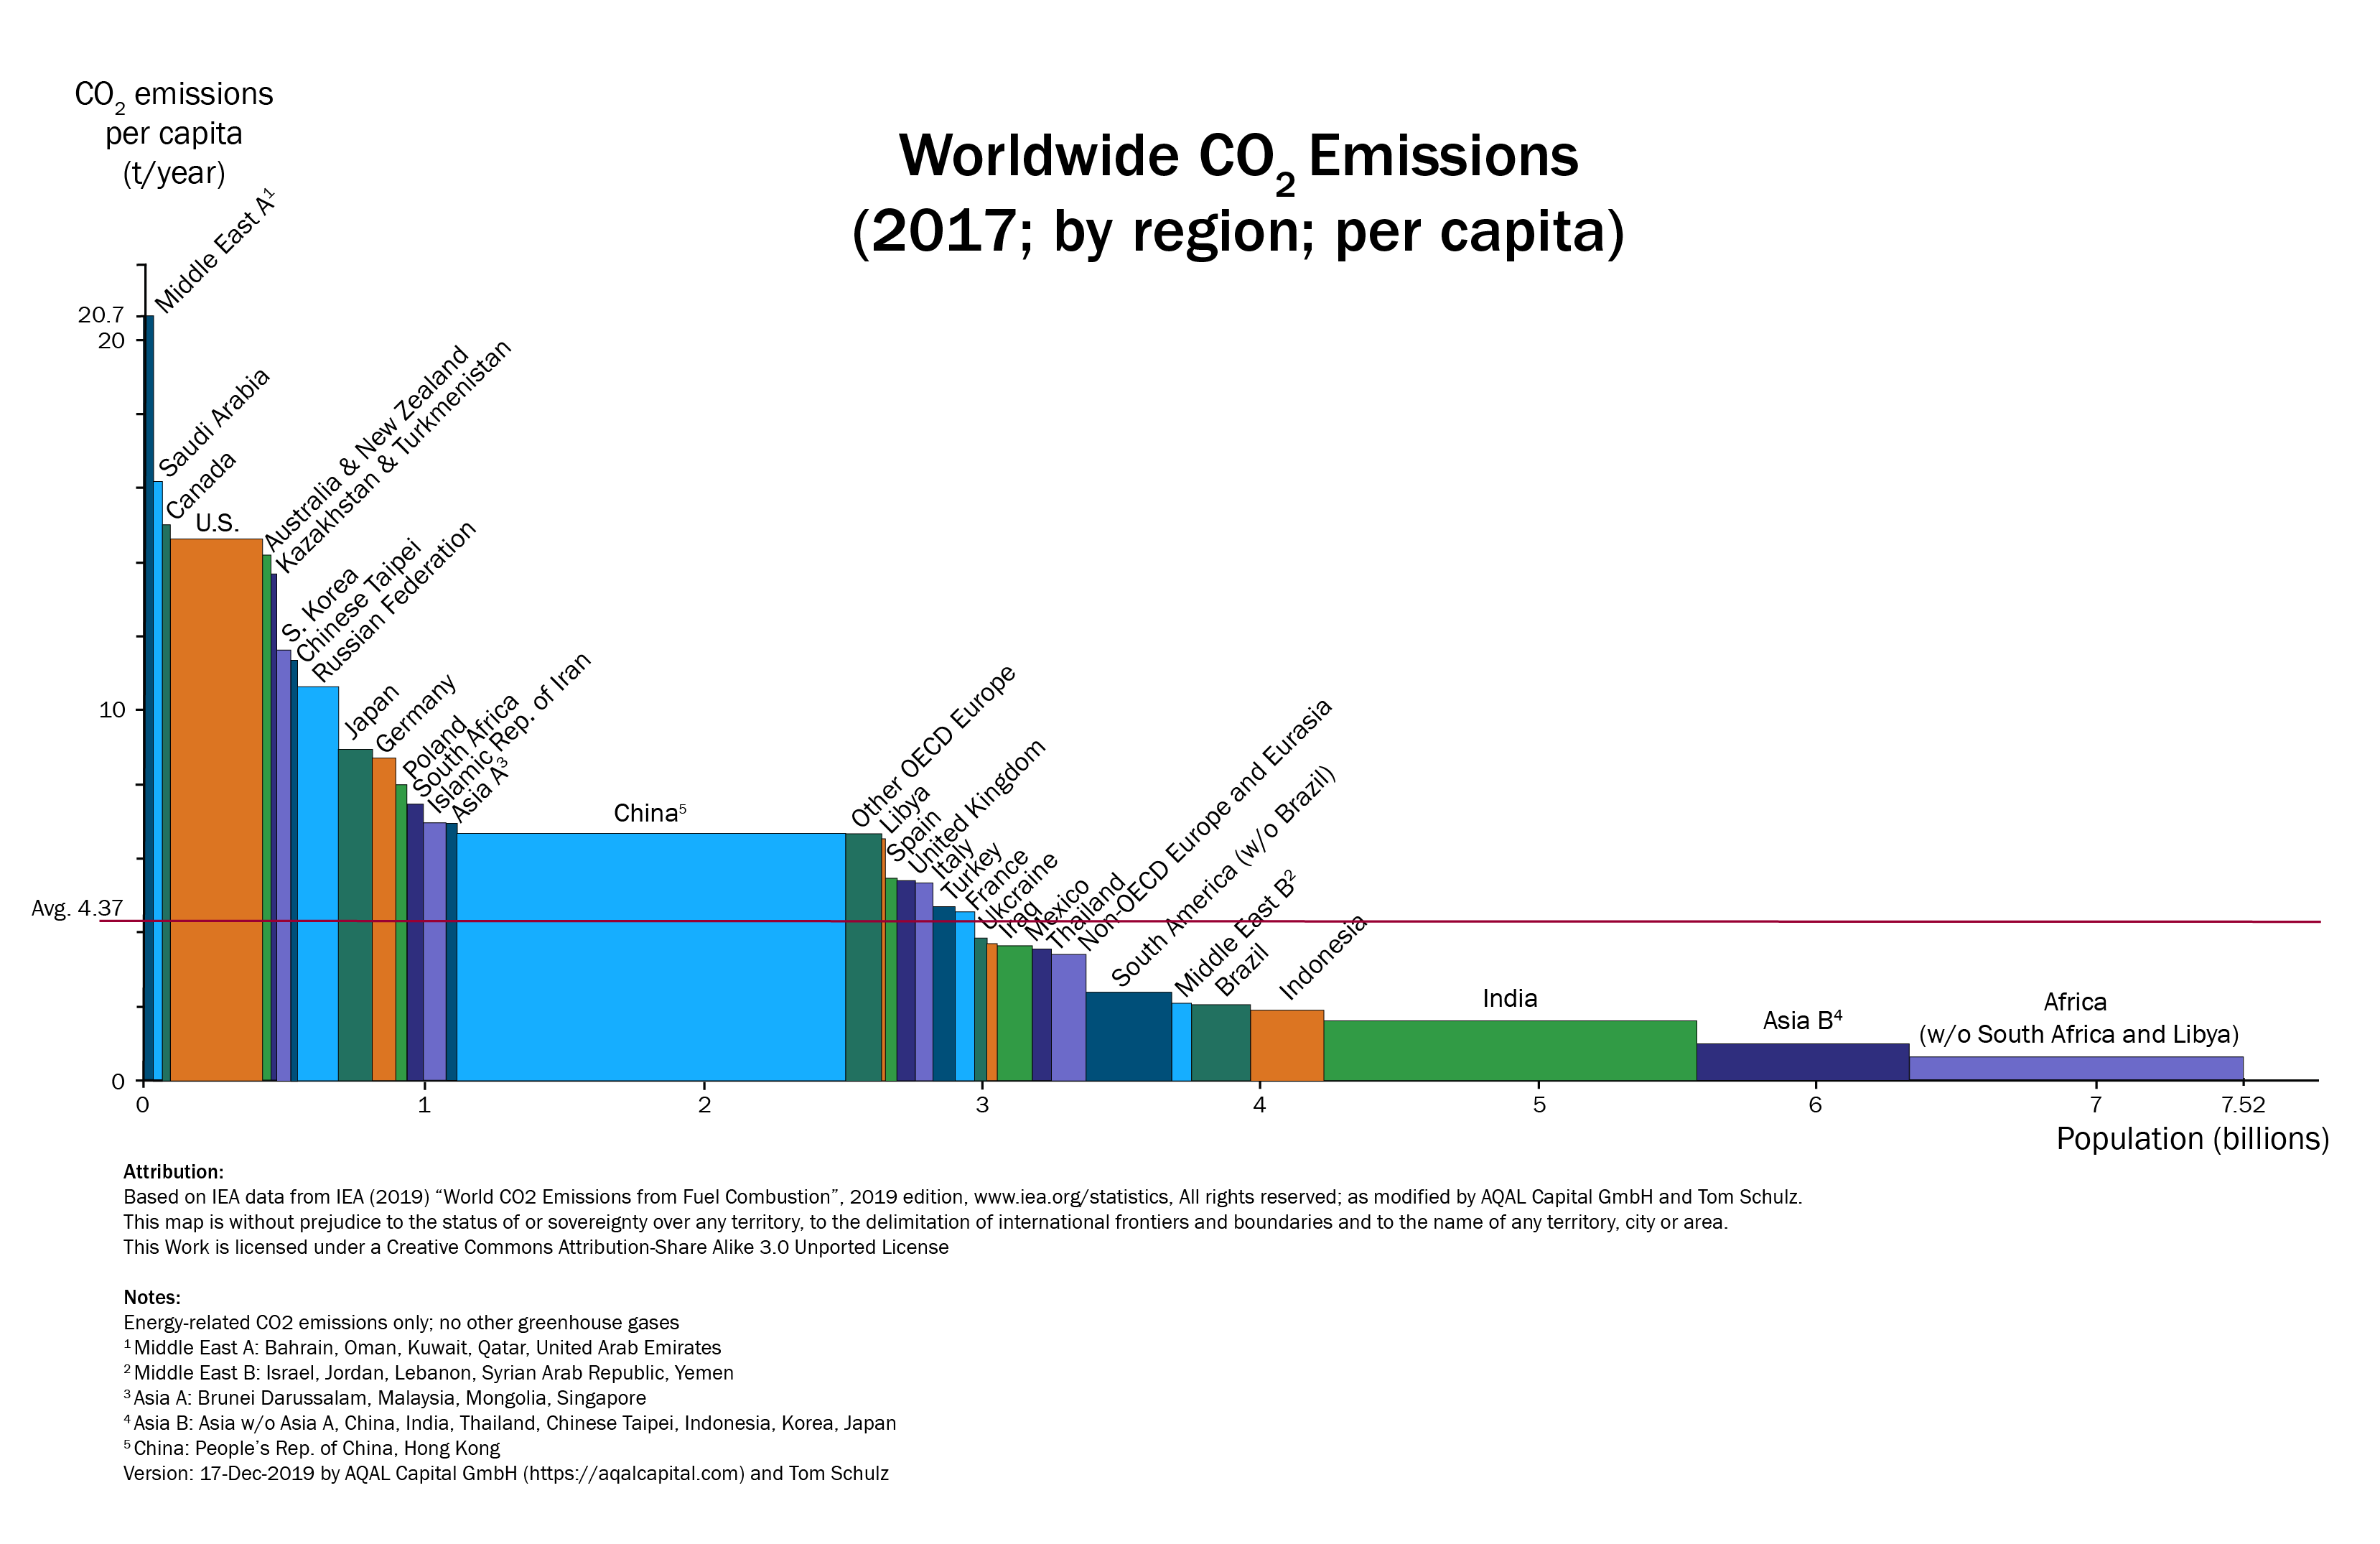
English: Tom Schulz, co-founder of Munich-based AQAL Capital, developed the variwide chart "Worldwide CO2 Emissions". The total CO2 emissions of a region is represented by a rectangular area. The height of each rectangle is proportional to the CO2 emissions per capita and the width is proportional to the population of the represented region. The regions are sorted by CO2 emissions per capita, from the highest to the lowest.
The data comes from the International Energy Agency, shows the 2017 status and was published in 2019 in CO2 "Emissions from Fuel Combustion 2019".[1] It becomes obvious that emissions vary widely from one country to the next with 30.4 t per capita in Qatar to 14.6 t per capita in the U.S., 6.7 t per capita in China, all the way down to Africa with 0.95 t per capita. The world average is 4.37 t per capita. Most industrialized nations range between 4 t and 15 t CO2 emissions per capita. Through this chart, it becomes obvious that the earth would not be able to absorb additional CO2 emissions to make room for additional developing nations like India and continents like Africa to “catch up” by increasing their per capita emissions to the current average.
|
| Date | |
| Source | Travail personnel |
| Auteur | Agreende |
Related image
-
 20210626 Variwide chart of greenhouse gas emissions per capita by country.svg —
more recent data; not only for CO2

Conditions d’utilisation
Moi, en tant que détenteur des droits d’auteur sur cette œuvre, je la publie sous la licence suivante :
Ce fichier est disponible selon les termes de la licence Creative Commons Attribution – Partage dans les Mêmes Conditions 3.0 (non transposée).
- Vous êtes libre :
- de partager – de copier, distribuer et transmettre cette œuvre
- d’adapter – de modifier cette œuvre
- Sous les conditions suivantes :
- paternité – Vous devez donner les informations appropriées concernant l'auteur, fournir un lien vers la licence et indiquer si des modifications ont été faites. Vous pouvez faire cela par tout moyen raisonnable, mais en aucune façon suggérant que l’auteur vous soutient ou approuve l’utilisation que vous en faites.
- partage à l’identique – Si vous modifiez, transformez, ou vous basez sur cette œuvre, vous devez distribuer votre contribution sous la même licence ou une licence compatible avec celle de l’original.
Historique du fichier
Cliquer sur une date et heure pour voir le fichier tel qu'il était à ce moment-là.
| Date et heure | Vignette | Dimensions | Utilisateur | Commentaire | |
|---|---|---|---|---|---|
| actuel | 22 janvier 2020 à 09:29 | | 3 315 × 2 150 (235 kio) | Agreende | Cross-wiki upload from en.wikipedia.org |
Utilisation du fichier
Les 2 pages suivantes utilisent ce fichier :
Usage global du fichier
Les autres wikis suivants utilisent ce fichier :
- Utilisation sur de.wikipedia.org
- Utilisation sur en.wikipedia.org