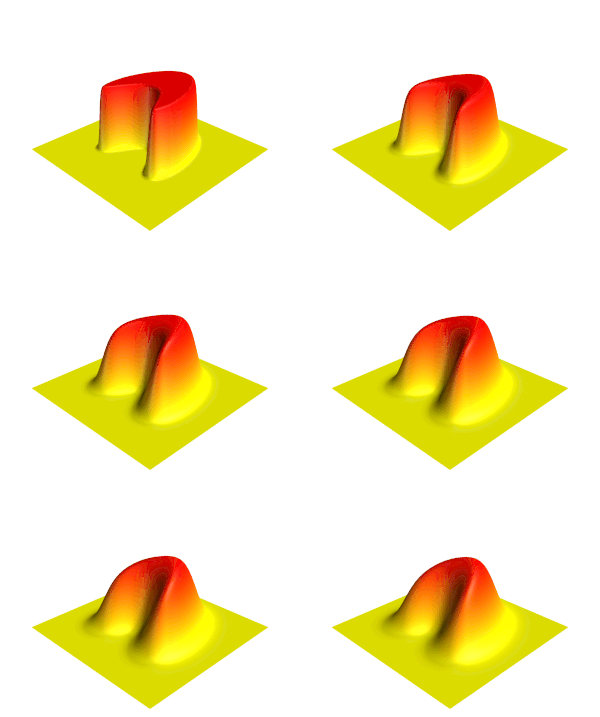
Fichier:Heat eqn.gif

Le contenu de la page n’est pas pris en charge dans d’autres langues.
Une page de Wikipédia, l'encyclopédie libre.

Heat_eqn.gif(200 × 136 pixels, taille du fichier : 500 kio, type MIME : image/gif, en boucle, 181 trames, 6,0 s)

Ce fichier et sa description proviennent de Wikimedia Commons.

Description

Description
English: Illustration of the Heat equation.
Date (UTC)
Source Travail personnel
 
Ce diagramme a été créé avec MATLAB.
Auteur Oleg Alexandrov
Autres versions

Conditions d’utilisation

Public domain Moi, propriétaire des droits d’auteur sur cette œuvre, la place dans le domaine public. Ceci s'applique dans le monde entier.
Dans certains pays, ceci peut ne pas être possible ; dans ce cas :
J’accorde à toute personne le droit d’utiliser cette œuvre dans n’importe quel but, sans aucune condition, sauf celles requises par la loi.

MATLAB source code

% illustration of the heat equation
% Solve the heat equation using finite differences and Forward Euler
function main()
 
   % the number of data points. More points means prettier picture.
   N = 400;
 
   L = 2.5; % the box size is [-L, L] x [-L, L]
 
   XX = linspace(-L, L, N);
   YY = linspace(-L, L, N);
   [X, Y] = meshgrid(XX, YY);
 
   scale = 2;
   Z = get_step_function (N, scale, X, Y);
 
   CFL = 0.125; % CourantFriedrichsLewy
   dx = XX(2)-XX(1);  dy = dx; % space grid
   dt = CFL*dx^2;
 
   plot_dt = 0.004; % plot every plot_dt iterations

   cmap = rv_matrix_rows(autumn); % colormap
   
   % Solve the heat equation with zero boundary conditions
   T = 0:dt:1;
   iter = 0;
   frame_no = 0;
   for t=T
 
      % plot the current temperature distribution
      if floor(t/plot_dt) + 1 > frame_no
 
         frame_no = frame_no + 1
 
        % plot the surface
         figure(2); clf; 
         surf(X, Y, Z);
 
         %  make the surface beautiful
         shading interp; colormap(cmap); 
 
         % add in a source of light
         camlight (-50, 54);
         lighting phong;
 
         % viewing angle
         view(-40, 38);
 
         axis equal; axis off;
         axis([-L, L, -L, L, 0, scale])
 
         hold on; plot3(0, 0, 3.4, 'g*'); % a marker to help with cropping
 
         pause(0.1);
         %return
 
         file = sprintf('Movie_frame%d.png', 1000+frame_no);
         %saveas(gcf, file) %save the current frame
         print(gcf, '-dpng', '-r400', file) %save the current frame
 
         disp(file); %show the frame number we are at
 
         % cut at max_fr_no frames
         max_fr_no = 15; 
         if frame_no >= max_fr_no
            break
         end
 
      end
 
      % advance in time
      W = 0*Z;
      for i=2:(N-1)
         for j=2:(N-1)
 
            W(i, j) = Z(i, j) + dt * ( Z(i+1, j) + Z(i-1, j) + Z(i, j-1) + Z(i, j+1) - 4*Z(i, j))/dx^2;
 
         end
      end
      Z = W;
 
   end
 
 
% The gif image was creating with the command 
% convert -antialias -loop 10000  -delay 20 -compress LZW Movie_frame10* Heat_eqn.gif 
 
% get a function which is 1 on a set, and 0 outside of it
function Z = get_step_function(N, scale, X, Y)
 
   c = 2;
   d=-1;
   e=1;
   f=0.5;
   k=1.2;
   shift=10;
 
   Z = (c^2-(X/e-d).^2-(Y/f).^2).^2 + k*(c+d-X/e).^3-shift;
 
   Z = 1-max(sign(Z), 0);
   Z = scale*Z;

function X = rv_matrix_rows(X)

   [m, n] = size(XL);

   for i = 1:m
      j = m + 1 - i;
      if i < j
         tmp = X(i, :); X(i, :) = X(j, :); X(j, :) = tmp;
      end
   end

Légendes

Ajoutez en une ligne la description de ce que représente ce fichier

Éléments décrits dans ce fichier

dépeint

image/gif

Historique du fichier

Cliquer sur une date et heure pour voir le fichier tel qu'il était à ce moment-là.

Date et heureVignetteDimensionsUtilisateurCommentaire
actuel2 février 2024 à 20:01Vignette pour la version du 2 février 2024 à 20:01200 × 136 (500 kio)Jahobrmore frames (by user Emil Dalalyan)
12 avril 2019 à 03:25Vignette pour la version du 12 avril 2019 à 03:25200 × 136 (172 kio)Jorge StolfiDuplicated some framed at beginning so that readers can see the initial state. Added a couple blank frames at end to make it clear that the simulation ended. Slowed down the movie a bit.
24 avril 2011 à 21:58Vignette pour la version du 24 avril 2011 à 21:58200 × 136 (116 kio)Oleg AlexandrovReverse the colormap (red is high).
23 novembre 2007 à 08:11Vignette pour la version du 23 novembre 2007 à 08:11199 × 140 (126 kio)Oleg AlexandrovTweak, same license
23 novembre 2007 à 07:51Vignette pour la version du 23 novembre 2007 à 07:51200 × 129 (112 kio)Oleg Alexandrov{{Information |Description=Illustration of the en:Heat equation |Source=self-made with Matlab |Date=~~~~~ |Author= Oleg Alexandrov |Permission=PD-self, see below |other_versions= }} {{PD-self}} ==MATLAB source code== <pre>

Les 3 pages suivantes utilisent ce fichier :

Usage global du fichier

Les autres wikis suivants utilisent ce fichier :