
Fichier:Cloud computing economics.svg

Taille de cet aperçu PNG pour ce fichier SVG : 483 × 444 pixels. Autres résolutions : 261 × 240 pixels | 522 × 480 pixels | 836 × 768 pixels | 1 114 × 1 024 pixels | 2 228 × 2 048 pixels.
Fichier d’origine (Fichier SVG, nominalement de 483 × 444 pixels, taille : 7 kio)
Ce fichier et sa description proviennent de Wikimedia Commons.
Description
| Description |
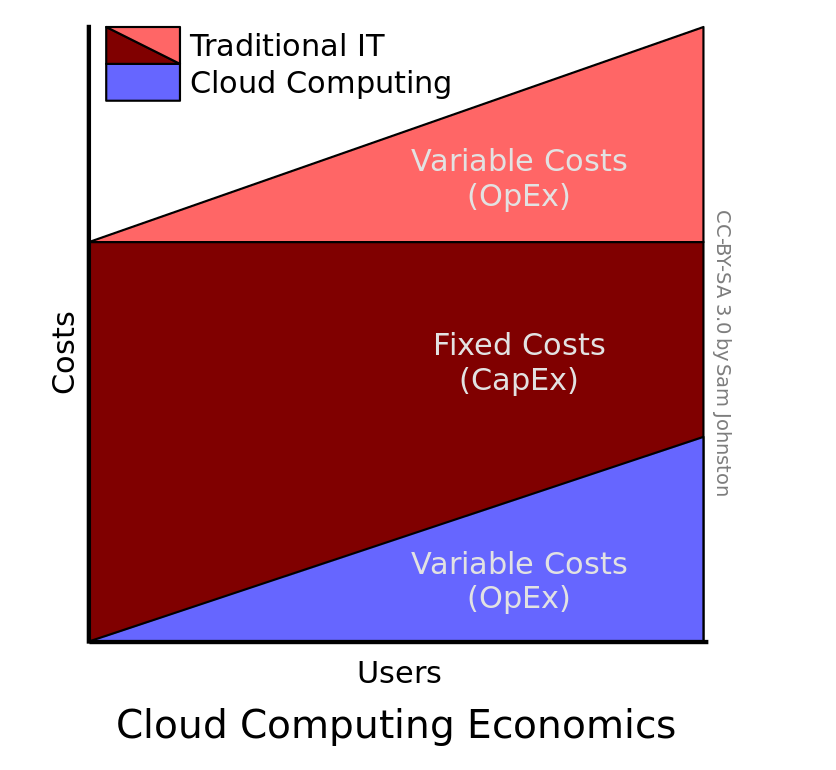
English: Diagram showing economics of cloud computing versus traditional IT, including capital expenditure (CapEx) and operational expenditure (OpEx) |
| Date | |
| Source | Created by Sam Johnston using OminGroup's OmniGraffle |
| Auteur | Sam Johnston |
| Autres versions |
[]
|


Although this diagram is meant to be qualitative, some effort went into the quantitative analysis too. The justification for the splits are a Forrester paper showing that the total cost of cloud computing deployments were 1/3 of that of traditional systems[1] and a CIO magazine article showing that variable costs traditionally account for 30-35% of overall spend[2].
References
Conditions d’utilisation
Moi, en tant que détenteur des droits d’auteur sur cette œuvre, je la publie sous la licence suivante :
Ce fichier est disponible selon les termes de la licence Creative Commons Attribution – Partage dans les Mêmes Conditions 3.0 (non transposée).
- Vous êtes libre :
- de partager – de copier, distribuer et transmettre cette œuvre
- d’adapter – de modifier cette œuvre
- Sous les conditions suivantes :
- paternité – Vous devez donner les informations appropriées concernant l'auteur, fournir un lien vers la licence et indiquer si des modifications ont été faites. Vous pouvez faire cela par tout moyen raisonnable, mais en aucune façon suggérant que l’auteur vous soutient ou approuve l’utilisation que vous en faites.
- partage à l’identique – Si vous modifiez, transformez, ou vous basez sur cette œuvre, vous devez distribuer votre contribution sous la même licence ou une licence compatible avec celle de l’original.
Historique du fichier
Cliquer sur une date et heure pour voir le fichier tel qu'il était à ce moment-là.
| Date et heure | Vignette | Dimensions | Utilisateur | Commentaire | |
|---|---|---|---|---|---|
| actuel | 6 mars 2009 à 04:14 | | 483 × 444 (7 kio) | SamJohnston | {{Information |Description={{en|1=Diagram showing economics of cloud computing versus traditional IT, including capital expenditure (CapEx) and operational expenditure (OpEx)}} |Source=Created by Sam Johnston using OminGroup's [[Wi |
Utilisation du fichier
La page suivante utilise ce fichier :
Usage global du fichier
Les autres wikis suivants utilisent ce fichier :
- Utilisation sur ca.wikipedia.org
- Utilisation sur en.wikipedia.org
- Utilisation sur hi.wikipedia.org
- Utilisation sur hu.wikipedia.org