
Fichier:Cshpi-peak nov09.svg

Taille de cet aperçu PNG pour ce fichier SVG : 300 × 310 pixels. Autres résolutions : 232 × 240 pixels | 464 × 480 pixels | 743 × 768 pixels | 991 × 1 024 pixels | 1 982 × 2 048 pixels.
Fichier d’origine (Fichier SVG, nominalement de 300 × 310 pixels, taille : 12 kio)
Ce fichier et sa description proviennent de Wikimedia Commons.
Description
| Description |
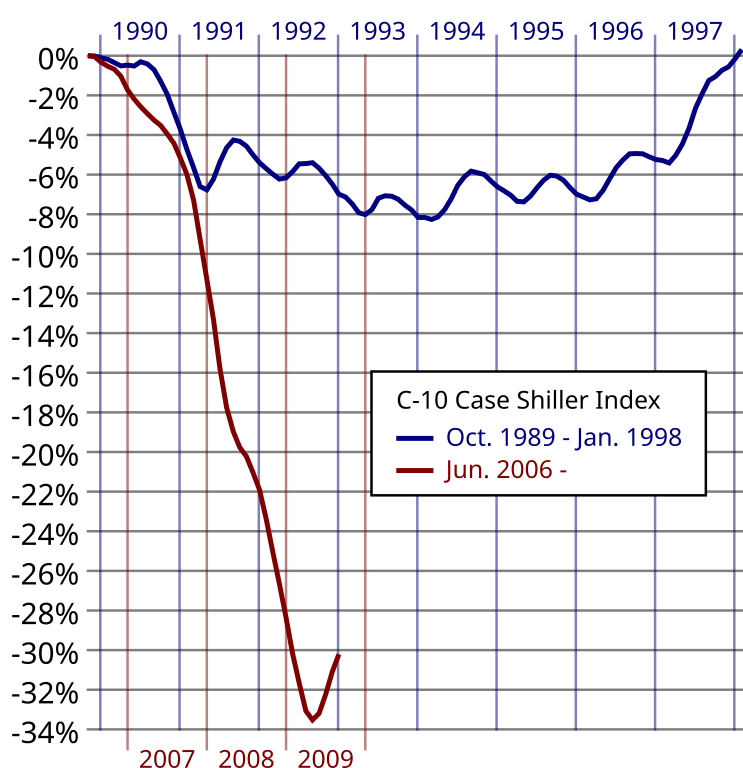
English: Change of the Case-Shiller Home Price Index relative to its peak values in 1989 and 2006.
Series starting in 1989 is in blue. Series starting in 2006 is in red. Source data is from Standard and Poors[1] Original jpeg graph from http://paper-money.blogspot.com/ released under Creative Commons Attribution 2.5 License. Feel free to update image with future data. Instructions are viewable in the SVG source. Do not edit with Inkscape or any other WYSIWYG editor. Use a text editor only. |
| Date | 28 octobre 2009 (date de téléversement originale) |
| Source | Transféré de en.wikipedia à Commons par gandalf-tof. |
| Auteur | Casito sur Wikipédia anglais |
Conditions d’utilisation
Ce fichier est disponible selon les termes de la licence Creative Commons Attribution 3.0 Non transposée.
- Vous êtes libre :
- de partager – de copier, distribuer et transmettre cette œuvre
- d’adapter – de modifier cette œuvre
- Sous les conditions suivantes :
- paternité – Vous devez donner les informations appropriées concernant l'auteur, fournir un lien vers la licence et indiquer si des modifications ont été faites. Vous pouvez faire cela par tout moyen raisonnable, mais en aucune façon suggérant que l’auteur vous soutient ou approuve l’utilisation que vous en faites.
Journal des téléversements d’origine
La page de description originale était ici. Tous les noms d'utilisateur qui suivent se rapportent à en.wikipedia.
- 2009-10-28 20:32 Graeme Bartlett 300×310× (12074 bytes) {{Information |Description = Updated graph for Case-Shiller house price index page, with new monthly values |Source = http://www.sundblad.se/Cshpi-peak.svg |Date = ~~~~~ |Author = user:Casito User:Ostermalm |Permission = [[WP:IFU]] clearly a derivative of existing graph |other_versions = }}
- 2009-06-30 22:14 Juan Toledo 300×310× (11749 bytes) New data for April 2009
- 2009-05-26 14:41 Juan Toledo 300×310× (11718 bytes) Reduced the legend text size, because Wikipedia is rendering it incorrectly
- 2009-05-26 14:39 Juan Toledo 300×310× (11718 bytes) Updated data and new integrated legend
- 2009-04-28 14:53 Juan Toledo 300×294× (10760 bytes) Reduced vertical scale in half
- 2009-04-28 14:24 Juan Toledo 300×550× (14344 bytes) Updated with data for Dec-2008 and Jan, Feb 2009
- 2009-01-27 18:26 Juan Toledo 300×470× (13336 bytes) Updated with new data for November 2008
- 2008-12-30 16:37 Juan Toledo 300×470× (12779 bytes) Updated with new data
- 2008-11-25 17:08 Juan Toledo 300×438× (12138 bytes) Change of the [[House price index|Case-Shiller Home Price Index]] relative to its peak values in 1989 and 2006. Series starting in 1989 is in blue. Series starting in 2006 is in red. <!-- Commented out because image was deleted: [[Image:Csi1207peakline
- 2008-10-15 20:21 Kaldari 300×406× (10947 bytes) updating with new data
- 2008-04-29 14:27 Poszwa 300×302× (9363 bytes) Updated the graph with current (as of 2008-04-29) data for Case-Shiller Index. Latest data available: February 2008.
- 2008-03-31 12:48 Poszwa 300×286× (9052 bytes) Updated the graph with current (as of 2008-03-31) data for Case-Shiller Index. Latest data available: January 2008.
- 2007-10-03 22:53 Casito 300×190× (7376 bytes) Change of the [[Case-Shiller Home Price Index]] relative to peak values in 1989 and 2006. Series starting in 1989 is in blue. Series starting in 2006 is in red. Created as an SVG replacement for [[Image:Csipeak2back0407.JPG]] Source data is from [Stan
--></nowiki>
Historique du fichier
Cliquer sur une date et heure pour voir le fichier tel qu'il était à ce moment-là.
| Date et heure | Vignette | Dimensions | Utilisateur | Commentaire | |
|---|---|---|---|---|---|
| actuel | 1 novembre 2009 à 18:15 | | 300 × 310 (12 kio) | Gandalf-tof | {{Information |Description={{en|Change of the Case-Shiller Home Price Index relative to its peak values in 1989 and 2006. Series starting in 1989 is in blue. Series starting in 2006 is in red. Source data is from Standard an |
Utilisation du fichier
La page suivante utilise ce fichier :